Figures & data
Table 1 Sociodemographic characteristics of pregnant women with urinary tract infection
Table 2 Organisms isolated from pregnant women with urinary tract infection
Figure 1 Pie chart showing uropathogens isolated from pregnant women with urinary tract infection.
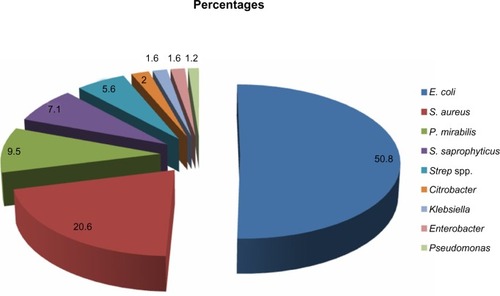
Table 3 Overall antibiotic sensitivity pattern (irrespective of bacterial isolates) to the isolated organisms
Figure 2 Line graph showing antibiotic sensitivity pattern of uropathogens with drugs that showed overall sensitivity pattern of ≥50%.
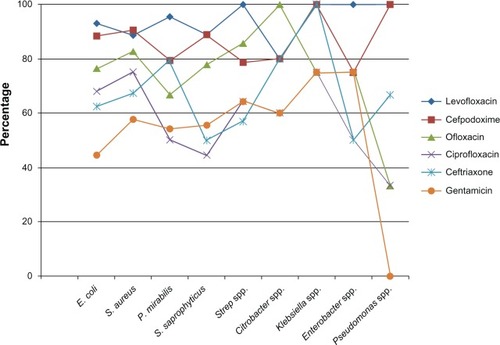
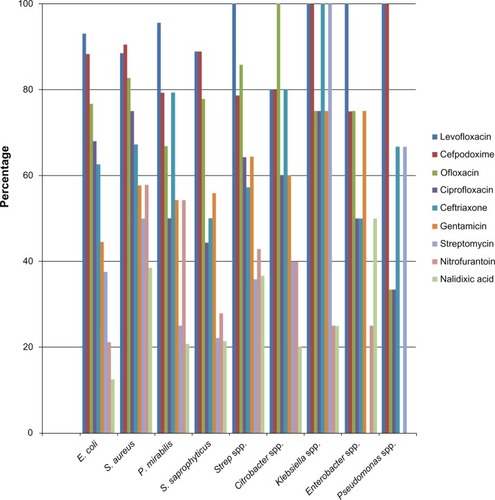
Table 4 Antibiotic sensitivity pattern of the isolated organisms
Figure 3 Bar graph showing antibiotic sensitivity pattern of uropathogens with drugs that showed individual sensitivity pattern of ≥50%.