Figures & data
Table 1 Clinical Characteristics of the Children CRKP Strains
Table 2 Clinical Characteristics of the Adults CRKP Strains
Figure 1 Difference in the prevalence of drug sensitivity resistance between children and adults. * is P value <0.05, *** is P value <0.001. The difference is statistically significant.
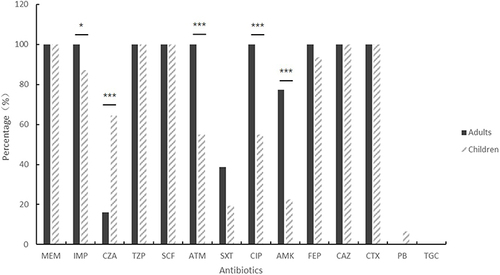
Figure 2 Difference in the detection rates of drug-resistant genotypes between children and adults. * is P value <0.05, ** is P value <0.01, *** is P value <0.001. The difference is statistically significant.
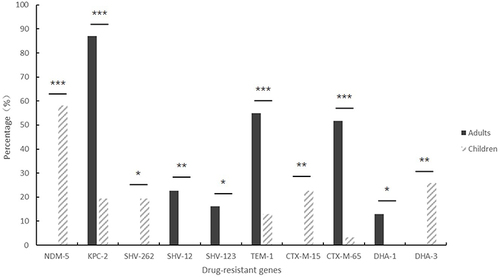
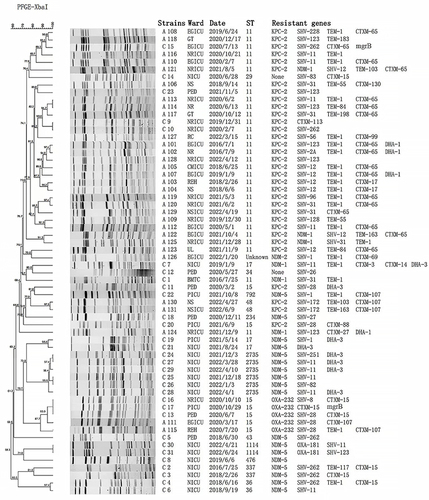
Figure 3 PFGE profile analysis of 62 strains of CRKP in children and adults. The UPGMA algorithm was performed to construct a dendrogram based on the dice similarity coefficient. Strains were classified as the same clone cluster when their dice similarity index was>85%.