Figures & data
Table 1 The MIC Values of L2724hy, L2724hy-KPC-EC600, L2724hy-NDM-EC600 and EC600
Figure 1 S1-PFGE profiles and southern blotting hybridization for L2724hy. S1-PFGE determines the number and size of plasmids in the strain. Southern blotting hybridization indicates the location of resistance genes blaSFO-1, blaNDM-1, and blaKPC-2.
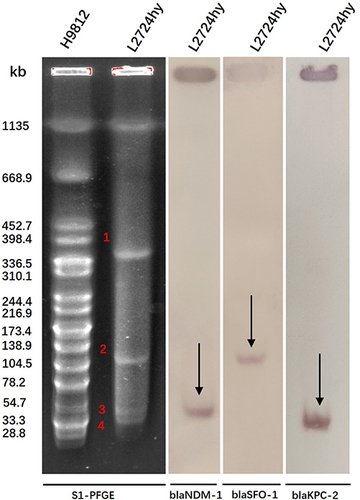
Table 2 The Genomic Characteristics of L2724hy
Figure 2 Comparative analysis of plasmids p2-L2724hy-SFO-1, p4-L2724hy-NDM-1, and p5-L2724hy-KPC-2 in L2724hy. The BRIG circle maps show plasmid resistance genes and mobile genetic elements (MGEs). (a) plasmid p2-L2724hy-SFO-1 carrying blaSFO-1 and fosA3. (b) plasmid p4-L2724hy-NDM-1 harboring blaNDM-1 and blaSHV-12. (c) plasmid p5-L2724hy-KPC-2 bearing blaKPC-2.
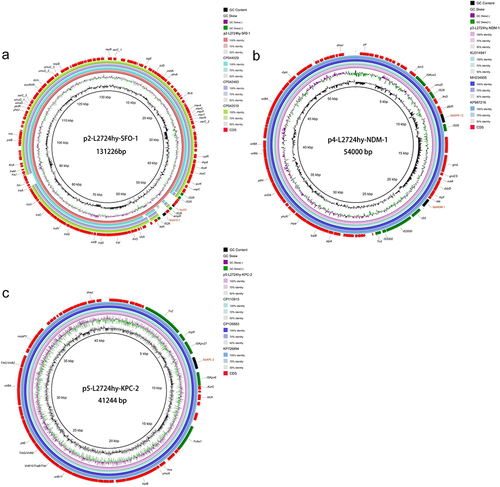
Figure 3 Genetic environment of blaSFO-1, blaNDM-1, and blaKPC-2 in L2724hy. (a) blaSFO-1 (b) blaNDM-1 (c) blaKPC-2. Red arrows denote drug resistance genes, green arrows denote transposons, pink arrows denote other genes, and yellow arrows represent hypothetical proteins.
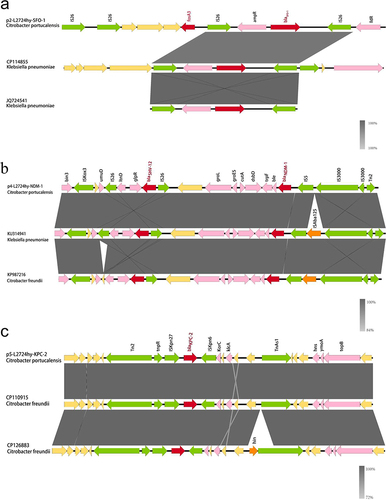
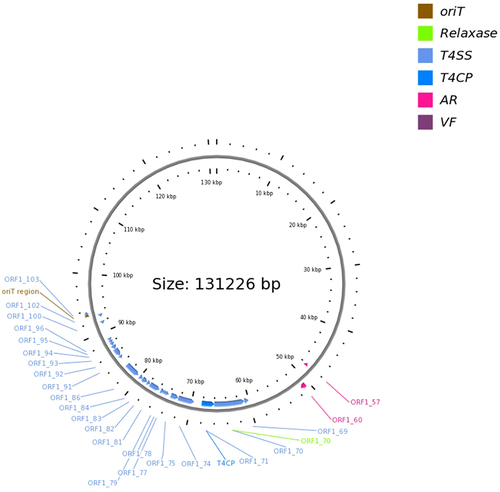
Figure 4 A conjugative plasmid p2-L2724hy-SFO-1. ORF1-57,fosA3; ORF1-60, blaSFO-1.