
Figures & data
Figure 1 Flowchart of the participants included in the present study.
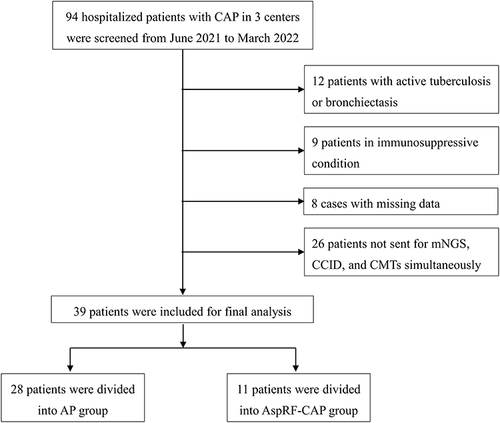
Table 1 Clinical Characteristics of the Study Participants
Figure 2 Microorganisms detected in patients with AP and AspRF-CAP. The column chart showed the numbers of microorganisms detected. A total of 213 and 31 strains of microorganisms were detected in patients with AP and AspRF-CAP, respectively. The left pie chart showed the detailed proportions of microorganism distribution in AP patients, including bacterial pathogen only (1/28, 3.57%), bacteria-fungi co-detection (13/28, 46.43%), bacteria-virus co-detection (1/28, 3.57%), and bacteria-fungi-virus co-detection (13/28, 46.43%). The right pie chart showed the detailed proportions of microorganism distribution in AspRF-CAP patients, including not detected (1/11, 9.09%), fungal pathogen only (1/11, 9.09%), bacteria-bacteria co-detection (1/11, 9.09%), fungi-fungi co-detection (1/11, 9.09%), bacteria-fungi co-detection (3/11, 27.28%), and bacteria-virus co-detection (4/11, 36.36%).
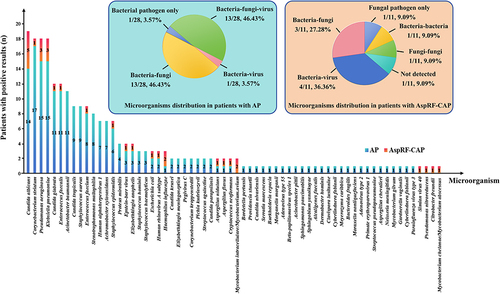
Figure 3 Comparison and overlap of isolated microorganisms between severe AP and non-severe AP. The column chart showed the numbers of microorganisms detected. A total of 123 and 90 strains of microorganisms were detected in 16 severe AP cases and 12 non-severe AP cases, respectively. The left pie chart showed the detailed proportions of microorganism distribution in severe AP patients, including bacteria-fungi co-detection (9/16, 56.25%) and bacteria-fungi-virus co-detection (7/16, 43.75%). The right pie chart showed the detailed proportions of microorganism distribution in non-severe AP patients, including bacterial pathogen only (1/12, 8.33%), bacteria-virus co-detection (1/12, 8.33%), bacteria-fungi co-detection (4/12, 33.33%), and bacteria-fungi-virus co-detection (6/12, 50.00%).
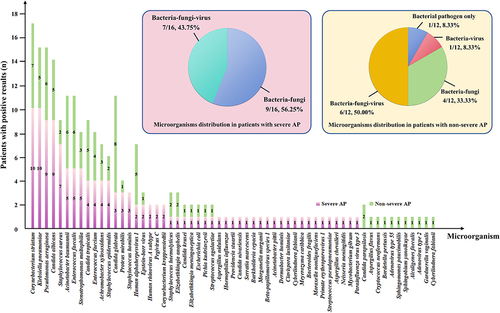
Figure 4 Microorganisms detected in non-survived patients. Klebsiella pneumoniae and Candida glabrata were the most common pathogens among the 9 non-survived AP patients, whereas Corynebacterium striatum and Candida glabrata were the most common pathogens in 2 non-survived AspRF-CAP patients.
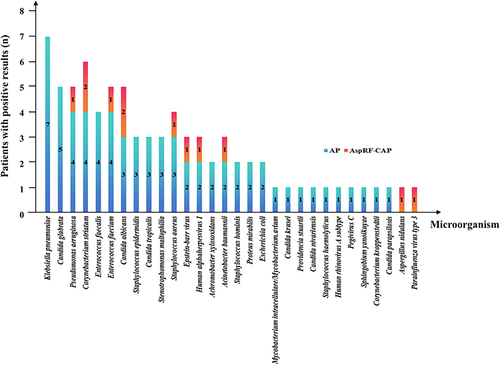
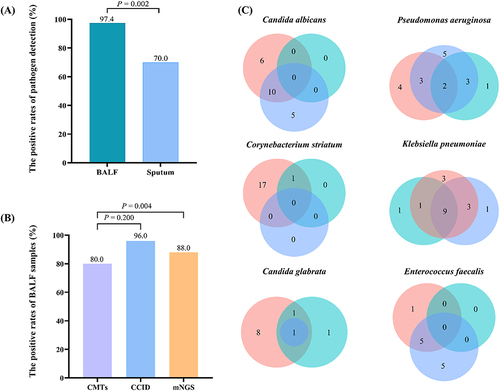
Figure 5 Comparison of diagnostic performance. (A) The positive rate of pathogen in BALF was significantly higher than that of sputum samples (97.4% vs 70.0%, P = 0.002). (B) The positive rate of pathogen with consistent BALF samples. The positive rate of mNGS was significantly higher than that of CMTs (88.0% vs 80.0%, P = 0.004). (C) Venn diagrams for specific pathogens detected according to different detected methods. Pink for mNGS. Blue for CCID. Cyan for CMTs. The numbers in the circles stand for cases.
Data Sharing Statement
Due to the personal privacy of the patients included in this study, the data sets used and analyzed in this study are not publicly available but are available from the corresponding authors upon reasonable request.