Figures & data
Figure 1 Schematic diagram overview of the study.
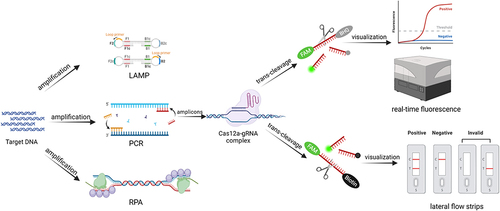
Figure 2 Limit of detection of CRISPR/Cas12a detection platform and activity validation of synthetic sgRNA. (A) The real-time fluorescence signals from 0 min to 60 min with different concentrations of target plasmids are shown. (B) The endpoint fluorescence signals with different concentrations of target plasmids are shown. Negative control (NC) utilized RNase-free water as input instead of target plasmid.
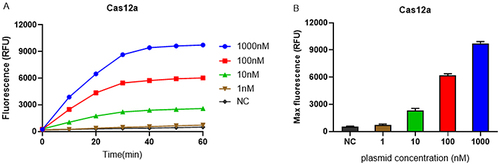
Figure 3 Sensitivity of PCR, LAMP and RPA combined with the CRISPR/Cas12 platform. (A,C and E) The real-time fluorescence signals of PCR-Cas12a, LAMP-Cas12a and RPA-Cas12a from 0 min to 60 min with different concentrations of the target plasmid are shown. (B,D and F) The endpoint fluorescence signals of PCR-Cas12a, LAMP-Cas12a and RPA-Cas12a with different concentrations of the target plasmid are shown. Negative control (NC) utilized RNase-free water as input instead of target plasmid.
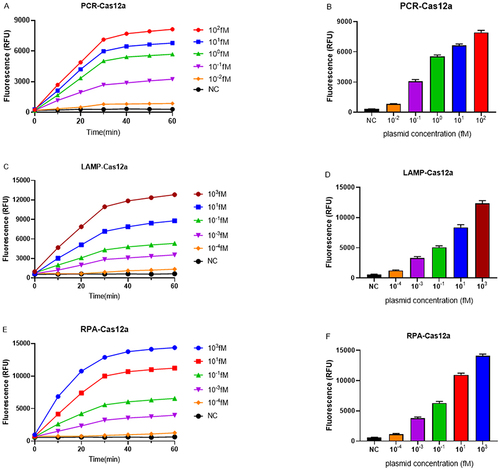
Figure 4 Specificity of RPA-Cas12a-based and LAMP-Cas12a-based detection methods for blaKPC gene. (A) The specificity of LAMP-Cas12a-based method for blaKPC gene. (B) The specificity of RPA-Cas12a-based method for blaKPC gene. Negative control (NC) utilized RNase-free water as input instead of target plasmid.
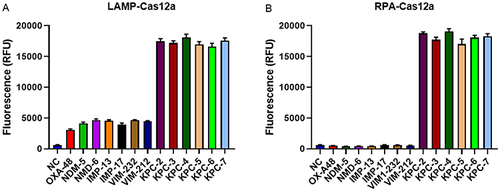
Figure 5 Sensitivity of RPA-Cas12a platform for Klebsiella pneumoniae strain carrying blaKPC gene. (A) The real-time fluorescence signals of RPA-Cas12a from 0 min to 60 min with different concentrations of the target plasmid are shown. (B) The endpoint fluorescence signals of RPA-Cas12a with different concentrations of the target plasmid are shown.Negative control (NC) utilized RNase-free water as input instead of target plasmid.
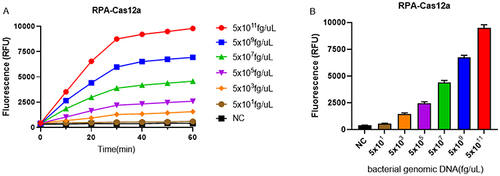
Figure 6 Sensitivity of RPA-Cas12a platform for Klebsiella pneumoniae strain carrying blaKPC gene. (A) The real-time fluorescence signals of RPA-Cas12a from 0 min to 60 min with different concentrations of the target plasmid are shown. (B) The endpoint fluorescence signals of RPA-Cas12a with different concentrations of the target plasmid are shown. Negative control (NC) utilized RNase-free water as input instead of target plasmid.
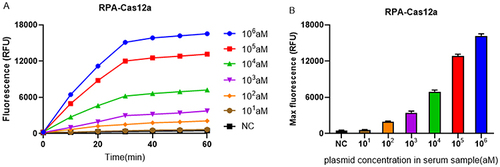
Figure 7 Application of RPA-Cas12a platform in clinical isolates. (A) 40 clinical isolates containing the blaKPC gene. (B) 40 clinical isolates containing other β-lactamase genes. Negative control (NC) utilized RNase-free water as input instead of target plasmid.
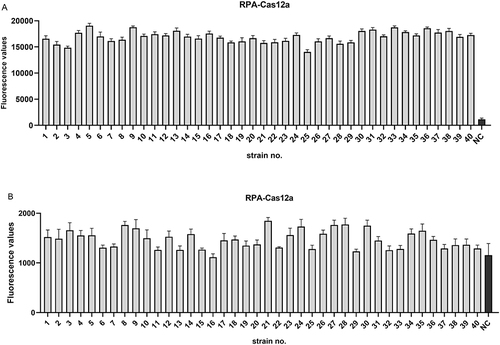
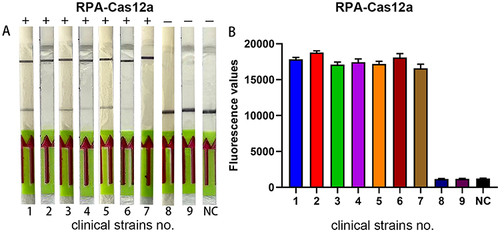
Figure 8 Application of the lateral flow strip visualization system. (A) Lateral flow strip results of clinical specimens. (B) endpoint fluorescence signal of clinical specimens. Clinical strains No. 1–7 are KPC-positive clinical isolates, and Clinical strains No. 8–9 are KPC-negative clinical isolates. Negative control (NC) utilized RNase-free water as input instead of target plasmid.