Figures & data
Table 1 Demographic and Clinical Characteristics of the Included Patients
Figure 1 The patients’ inclusion flow chart. 76 DR-TB patients were included in the analysis of linezolid concentration and hematological toxicity.
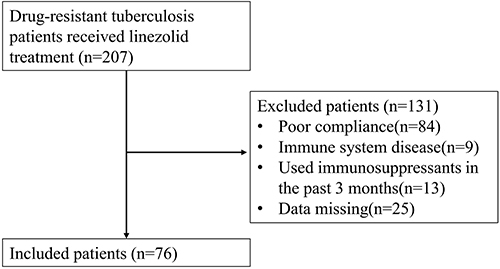
Table 2 Univariate Analysis Results
Table 3 Multivariate Analysis Results
Figure 2 Univariate analysis results of linezolid. The Cmax between different age (A), weight (B), Ccr (Creatinine clearance) (C). *P< 0.05, **P<0.01.
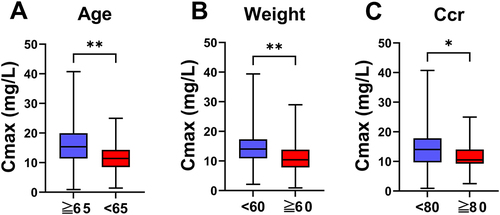
Figure 3 Biochemical indexes of patients before and after linezolid therapy. The change of hemoglobin (A), platelet count (B), white blood cells (C) before and after linezolid treatment. ***P<0.001, ns means no significance.
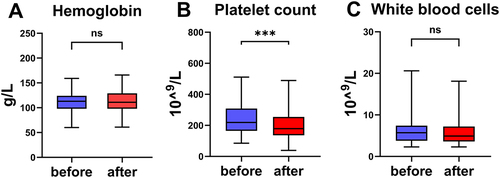
Figure 4 Distribution of linezolid concentrations in patients with or without hematological toxicity. Linezolid Cmax of linezolid with or without anemia (A), thrombocytopenia (B), leukopenia (C). *P<0.05, ns means no significance.
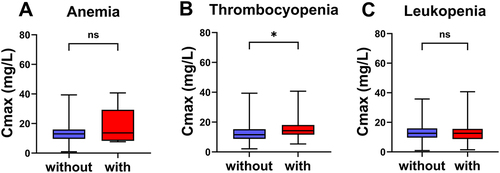
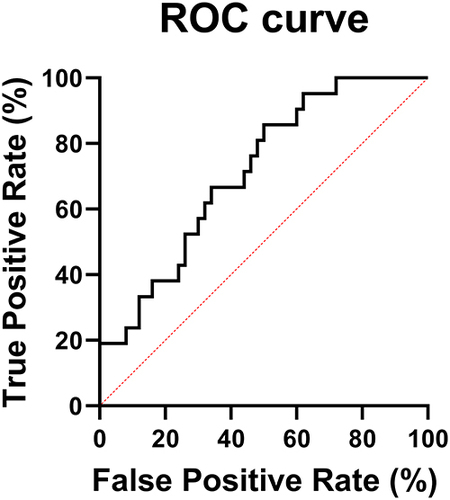
Figure 5 ROC curve for predicting hematological toxicity of linezolid Cmax.