
Figures & data
Figure 1 Annual change in incidence risk per 1000 hospital admissions of candidemia, 2015–2022. The figure showed the change in the total incidence of candidemia and the incidence rate of two major types of candidemia in our study.
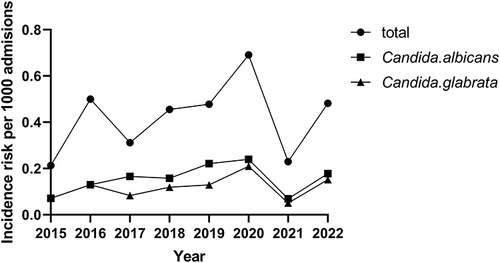
Figure 2 Distribution of Candida species isolates, 2015–2022. The most prevalent species was Candida albicans, followed by Candida glabrata, Candida parapsilosis, Candida tropicalis and others Candida spp.
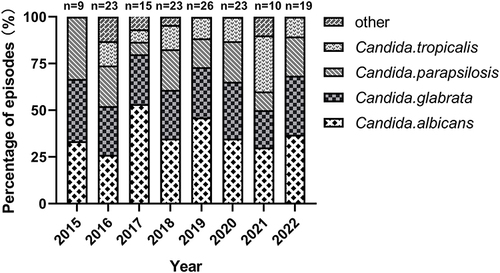
Table 1 Antifungal Susceptibility of Candida Spp. Isolated
Table 2 Overall Characteristics and Univariate Analysis of Mortality in Patients with Candidemia
Figure 3 Kaplan–Meier survival analysis for candidemia. Patients treated with antifungal drugs and patients not treated with antifungal drugs were included (p<0.001).
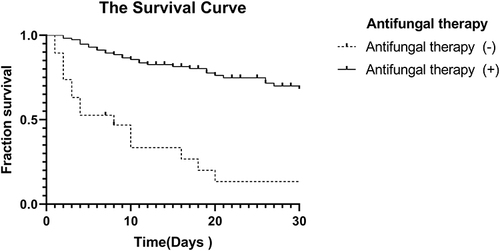
Table 3 Multivariate Analysis of Factors Associated with 30-Day Mortality in Patients with Candidemia