Figures & data
Figure 1 Epidemic curve, Central Scotland 1996 outbreak.
Note: Data from Pennington.Citation20
Abbreviations: Nov, November; Dec, December.
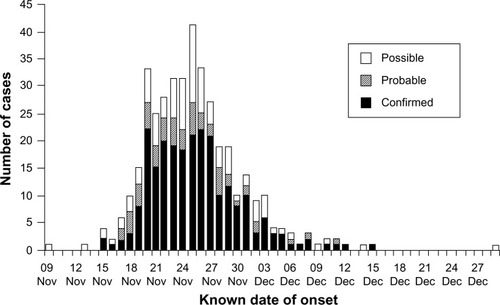
Figure 2 Epidemic curve, Church Hall component of the Central Scotland outbreak.
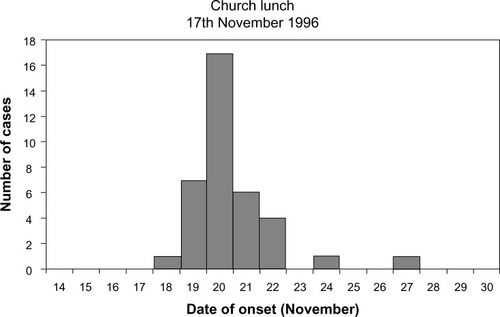
Figure 3 Epidemic curve, South Wales 2005 outbreak.
Notes: © Queen’s Printer and Controller of HMSO; 2009. Pennington TH. The Public Inquiry into the September 2005 Outbreak of E. coli O157 in South Wales. Aberdeen: HMSO; 2009. Available from: http://wales.gov.uk/ecolidocs/3008707/reporten.pdf?skip=1&lang=en.Citation17
Abbreviation: NPHS, Public Health Service for Wales.
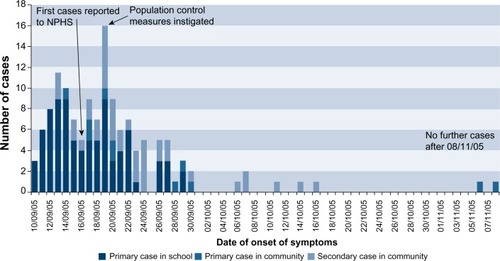
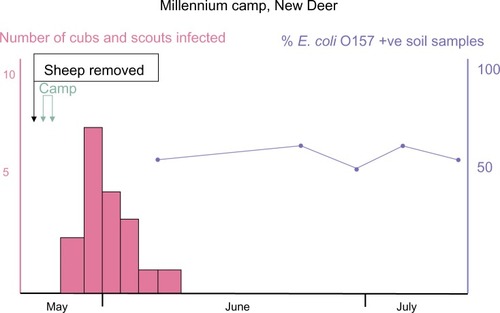
Figure 4 Epidemic curve, New Deer scout camp 2000 outbreak.