Figures & data
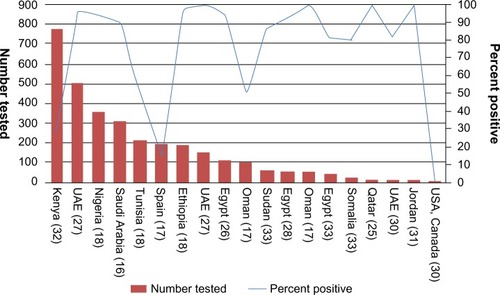
Figure 1 A map of the Kingdom of Saudi Arabia showing the main cities described in this paper:Riyadh (the capital); Al-Hasa (2013 outbreak); Jeddah (2014 outbreak); Hafr Al-Batin(community cluster); and the holy Cities (Makkah and Madinah).
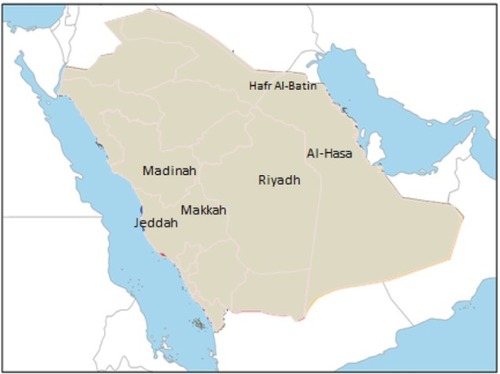
Table 1 A summary of demographics of major MERS-CoV studies
Table 2 A summary of the serology results of juvenile and adult (>2 years old) camelsin different studies
Figure 2 A graph showing the total number of tested camels and the percentage positive.
Note: x-axis shows the country of testing (reference number).
Abbreviation: UAE, United Arab Emirates.