
Figures & data
Table 1 Baseline characteristics of 1,098 patients with Escherichia coli BSI stratified by ESBL production
Figure 1 (A–D) Distribution of genotypes and phylogenetic groups of 95 extended-spectrum β-lactamase (ESBL)-producing Escherichia coli isolates from patients with bloodstream infection. (A) ESBL genes in all 95 ESBL E. coli isolates (n=95); (B) phylogenetic groups of all 95 ESBL E. coli isolates; (C) phylogenetic groups of CTX-M-15 E. coli isolates (n=55); (D) phylogenetic groups of CTX-M-1 E. coli isolates (n=21).
Abbreviation: ESBL, extended-spectrum β-lactamase.
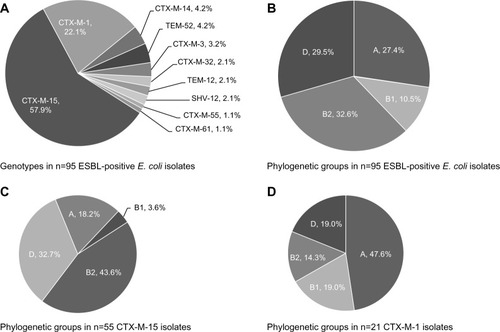
Table 2 Results of the multivariable regression analysis of risk factors for mortality in cases of Escherichia coli bloodstream infection (BSI)