Figures & data
Table 1 Antimicrobials given prior to the onset of central line-associated bloodstream infection (n=33 cases)
Table 2 Logistic regression analyses on the risk factors for CLABSI, including ward-specific AUD of multiple agents
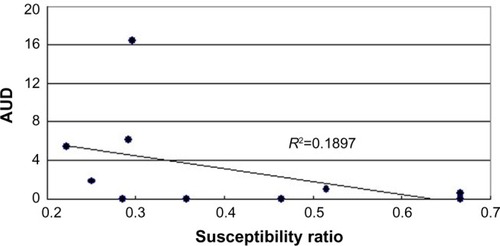
Figure 1 Correlation between susceptibility ratio (horizontal axis) defined as the number of susceptible strains divided by the number of all strains undergoing susceptibility versus the median values for antimicrobial use density (AUD, vertical axis). They show a negative correlation (superimposed line) with R2=0.1897 for ten drugs available indicating increase in AUD was associated with decrease in susceptibility of the same antimicrobial.