Figures & data
Figure 1 HIV-1 DNA integration. HIV-1 virus synthesizes a dsDNA (red) copy of its RNA genome following entry of the virus into host cell cytoplasm. HIV-1 integrase removes 3′ end GT dinucleotides on both viral DNA ends to expose a 3′ hydroxyl group on terminal adenosines by 3′ processing. The 3′ processed viral DNA is then imported into the nucleus where strand transfer occurs resulting in the integration of the two viral DNA ends into host DNA (black) at positions five base pairs (bp) apart. Host DNA repair enzymes then cleave unpaired viral CA dinucleotides, fill in the five bp gaps (green), and ligate the DNA ends.
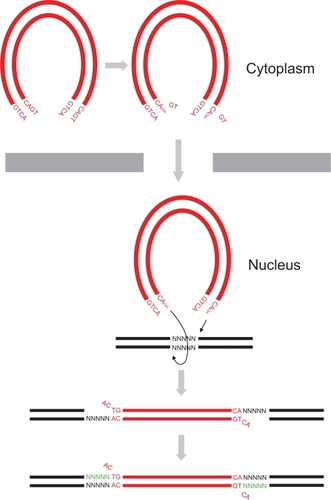
Figure 2 Structures of raltegravir and elvitegravir. A) Raltegravir. B) Elvitegravir. The β-hydroxy ketone and halobenzyl moieties are indicated. The atoms are indicated and/or represented by different colored spheres: C, gray; O, red; N, blue; Cl, green; F, brown. Hydrogen atoms are not shown. The chemical structures were created using MarvinSketch software (ChemAxon, Budapest, Hungary).
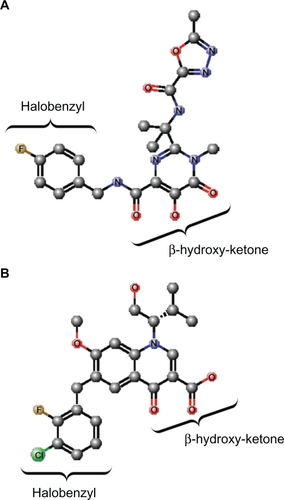
Figure 3 Structure of the PFV IN active site. A) Structure of PFV IN active site within 14Å of Mn2+ ions showing location of the three active site residues (red sticks), three residues where primary resistance mutations occur (yellow sticks), and Mn2+ ions (green spheres). B) Structure of PFV IN active site in complex with raltegravir showing the three oxygen atoms (red spheres) of the β-hydroxy ketone moiety chelating the Mn2+ ions. The halobenzyl moiety (with brown fluoride atom) is seen stacked close to the cytosine (C) of the CA dinucleotide of the donor DNA strand (purple sticks) which results in the displacement of the terminal adenosine (A) and its 3′ hydroxyl group from the active site. C) Structure of PFV IN active site within 20Å of Mn2+ ions showing location of some of the residues where secondary resistance mutations occur (cyan sticks). PFV residues are indicated, and the corresponding HIV-1 residues are in brackets. The nontransferred DNA strand is shown as brown sticks. Protein data bank codes are 3OY9 and 3L2V,Citation31 and the diagrams were created using RasMol software (University of Massachusetts, Amherst, MA, USA).
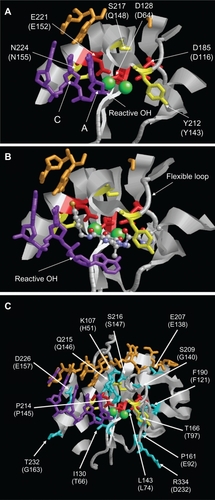
Table 1 Secondary resistance mutation patterns associated with Q148HRK
Table 2 Secondary resistance mutation patterns associated with N155H
Table 3 Secondary resistance mutation patterns associated with Y143CHRK
Figure 4 Schematic representation of the evolution of raltegravir primary resistance mutations. Initially, mutations conferring resistance to raltegravir have been shown to primarily occur at residues Q148 and N155. Subsequently, switches from 148 or 155 pathways to 148 or 143 pathways have been observed.
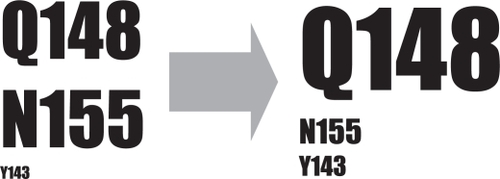
Table 4 Other integrase resistance mutation patterns