
Figures & data
Figure 1 Plasma daptomycin concentration–time curves at steady state (day 4).
Notes: Antimicrob Agents Chemother, 2006;50(10):3245–3249. DOI: 10.1128/AAC.00247-06,Citation8 reproduced with permission from American Society for Microbiology.
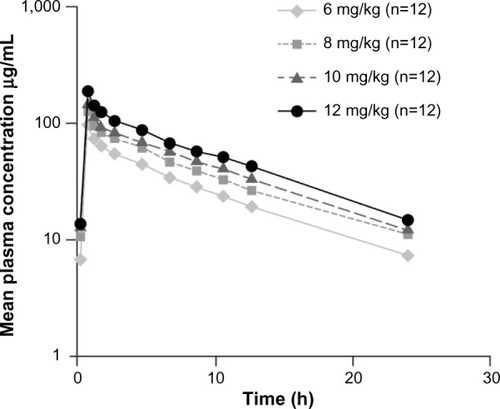
Table 1 Pharmacokinetics of daptomycin in special populations
Table 2 Characteristics of the main efficacy and safety studies for daptomycin
Table 3 Clinical outcome and safety in high-dose daptomycin studies