
Figures & data
Table 1 Demographic characteristics of study participants
Table 2 Behavioral changes after notification of test results among participants who had not reduced salt intake
Table 3 Behavioral changes after notification of test results among participants who had already reduced salt intake
Figure 1 Behavioral modifications following notification of hypothetical genetic test results of salt sensitivity.
Notes: The proportions of positive and negative behavioral modifications as a result of notification of hypothetical results in the hypertensive patients (black) and nonhypertensive patient (light gray) groups are presented. The proportion of positive behavioral modifications in the hypertensive patients (n=152) and nonhypertensive patients (n=608) were 48.7% (n=74) and 66.1% (n=402), respectively, after being notified of the result “If with genetic risk” (P<0.001, chi-square test); and 29.0% (n=44) and 31.6% (n=192), respectively, after being notified of the result “If without genetic risk” (P=0.531, chi-square test). The proportion of negative behavioral modifications in hypertensive patients (n=558) and nonhypertensive patients (n=1,086) were 1.3% (n=7) and 1.9% (n=21), respectively, after being notified of the result “If with genetic risk” (P=0.314, chi-square test) and 10.9% (n=61) and 7.6% (n=82), respectively, after being notified of the result “If without genetic risk” (P=0.021, chi-square test).
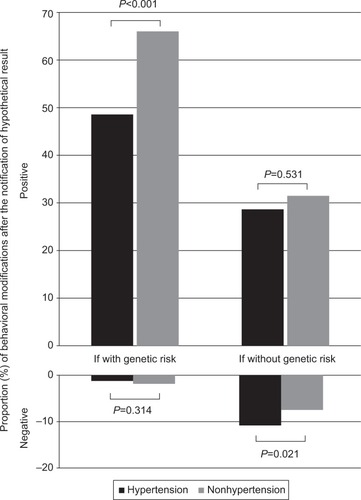
Table 4 Relative ratios of behavioral modifications after notifications of genetic risk between hypertensive and nonhypertensive patients