Figures & data
Table 1 Baseline clinical characteristics
Table 2 Echocardiographic parameters
Figure 1 Kaplan Meier survival estimates based on presence, absence, and degree of PH by TR jet: group 1 = no TR, and TR < 2.5 m/s; group 2 = TR 2.5–3.0 m/s; group 3 = TR > 3.0 m/s (P = 0.0004). At 12 months, mortality was 44% (8/18) in group 3 versus 6% (3/48) and 12.5% (3/24) in groups 1 and 2, respectively (P = 0.001). The P = 0.0004 is based on the time to event analysis and signifies an overall difference between the 3 curves/groups. P = 0.001 is based on a chi-square test for the number of deaths by 12 months between the 3 groups.
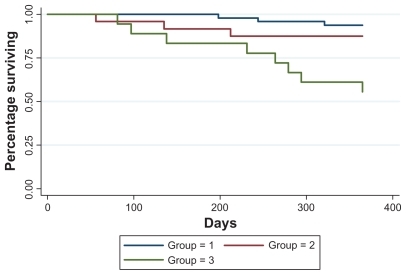
Table 3 Analysis by survivors and non-survivors
Table 4 Review of studies evaluating pulmonary hypertension in patients with end stage renal disease