
Figures & data
Figure 1 Outline of the respondents.
Abbreviation: HADS, Hospital Anxiety and Depression Scale.
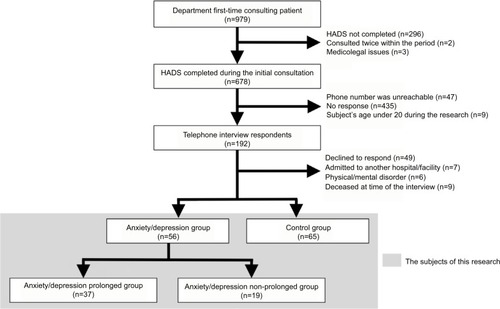
Table 1 Survey item at each stage
Table 2 Baseline characteristics of each group (n=121)
Table 3 Results of evaluation items (n=121)
Figure 2 Correlation between the initial consultation and the telephone survey.
Abbreviation: HADS, Hospital Anxiety and Depression Scale.
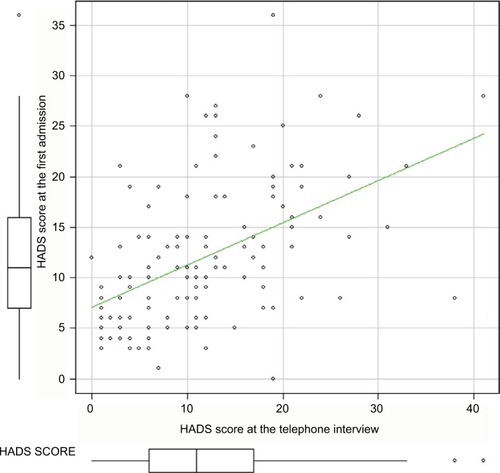
Table 4 Impact of factors on prolongation of anxiety/depression