Figures & data
Table 1 Fatty acid profile (g/100 g), vitamins A and E and thiobarbituric acid reactive substances in seal oil
Table 2 Food items suspected by patients to cause food hypersensitivity
Figure 1 Total sum score for SHC in patients with self-reported food hypersensitivity (n = 26), measured before and after seal oil treatment, and 1 month posttreatment. Individual values are displayed, and P values are indicated.
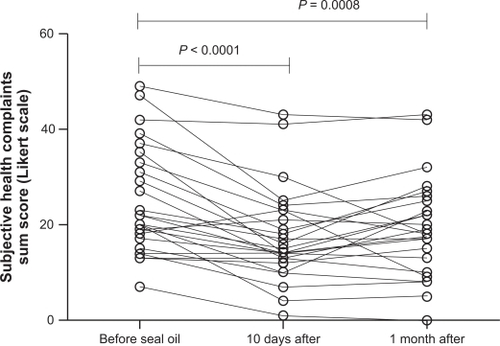
Table 3 SHC : Mean score ± SEM for total sum and subscales before seal oil, 10 days after seal oil, and 1 month posttreatment with seal oil
Table 4 Number (percentage) of individuals with complaints for each item of the SHC inventory before seal oil, 10 days after seal oil, and 1 month posttreatment with seal oil
Figure 2 Total sum score for SF-NDI in patients with self-reported food hypersensitivity (n = 26), measured before and after seal oil treatment, and 1 month posttreatment. Individual values are displayed, and P values are indicated.
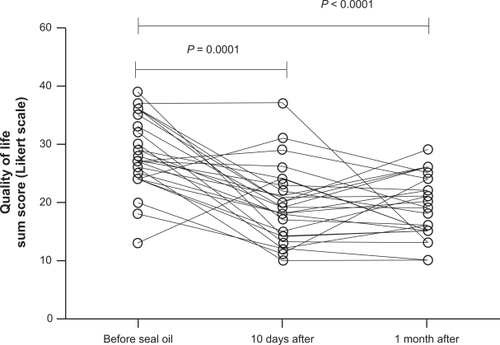
Table 5 QoL on SF-NDI: Mean score ± SEM for total sum and subscales before seal oil, 10 days after seal oil, and 1 month posttreatment with seal oil
Figure 3 Total sum score for GSRS A) and UESS B) in patients with self-reported food hypersensitivity (n = 26), measured before and after seal oil treatment, and 1 month posttreatment. Individual values are displayed and P values are indicated.
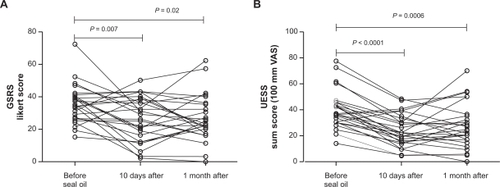
Table 6 Mean score (±SEM) for subscales in GSRS and UESS before seal oil, 10 days after seal oil, and 1 month posttreatment with seal oil