
Figures & data
Figure 1 Flow diagram of logical AND two-tier test methodology for Lyme disease.
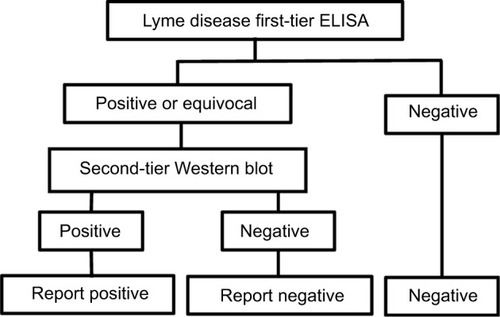
Figure 2 Flow diagram of logical OR test methodology for HIV.
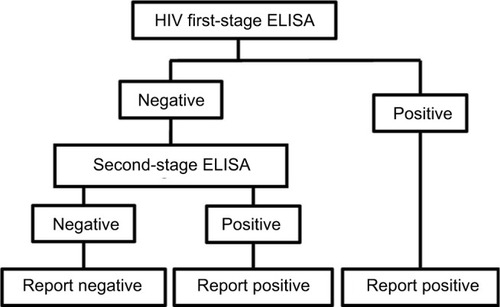
Table 1 HIV “rapid” serology test performance
Table 2 Lyme disease serology test performance
Table 3 Probability of having Lyme disease given a positive test
Table 4 False-positive results from C6 ELISA and HIV tests with the probability of not having Lyme disease given a positive test
Table 5 Probability of disease with a single-test and the two-tier test method
Table 6 False-positive probability for single-stage and two-tier testing
Table 7 Comparison of false-negative results for LD and HIV testing methodologies
Figure 3 False-negative percentage based on sensitivities with positive samples.
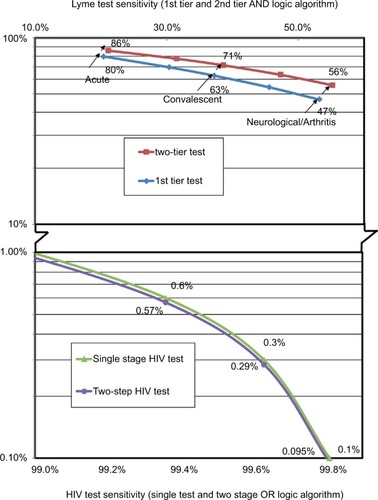
Figure S1 Dependence of enzyme-linked immunosorbent assay and Western blot test.
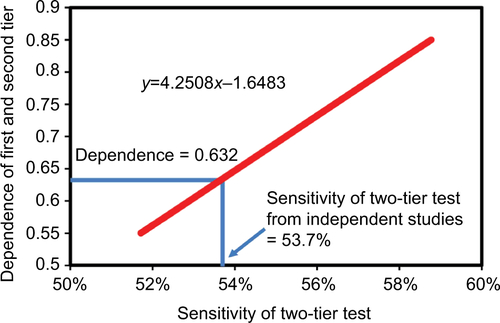
Figure S2 False-negative percentage based on test sensitivities with “clinical” samples.
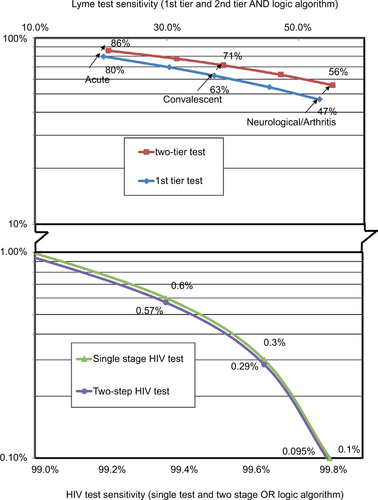
Table S1 Lyme disease serology test performance based on clinical samples
Table S2 Lyme disease test kit sensitivity for various disease stages based on clinical samples
Table S3 Comparison of false-negative probabilities for LD and HIV testing based on clinical samples