
Figures & data
Figure 1 Representative image of PFS (open arrow heads).
Abbreviation: PFS, perirenal fat stranding.
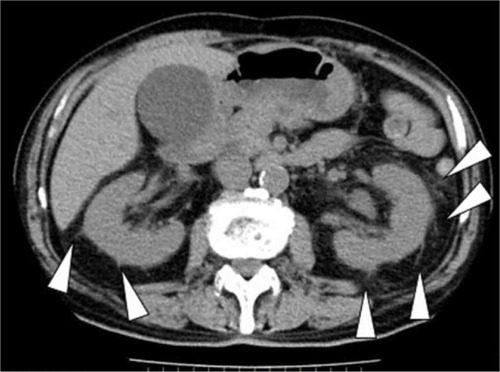
Figure 2 Flowchart showing participant screening for this study.
Abbreviations: ICD-10, 10th revision of the International Statistical Classification of Diseases and Related Health Problems; CT, computed tomography; PRB, percutaneous renal biopsy; UTI, urinary tract infection.
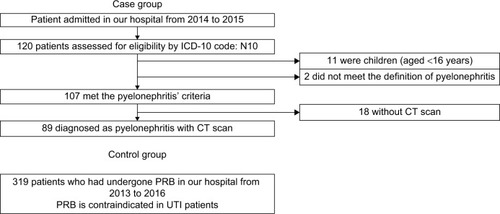
Table 1 Patient characteristics
Table 2 Sensitivity, specificity, and positive likelihood ratio of PFS to diagnose acute pyelonephritis for all enrolled patients
Figure 3 Frequency of PFS by age group.
Abbreviations: PFS, perirenal fat stranding; NS, not significant.
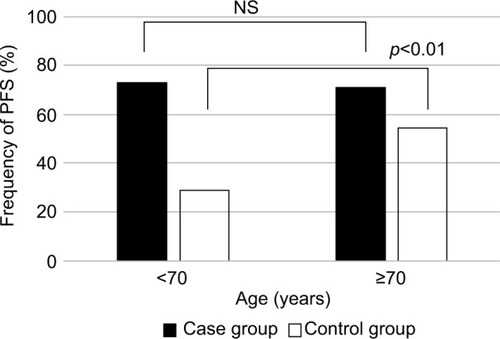
Figure 4 Frequency of PFS by sex.
Abbreviations: PFS, perirenal fat stranding; NS, not significant.
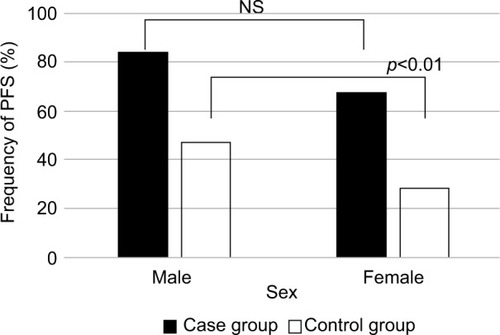
Figure 5 Frequency of PFS by eGFR.
Abbreviations: PFS, perirenal fat stranding; eGFR, estimated glomerular filtration rate; NS, not significant.
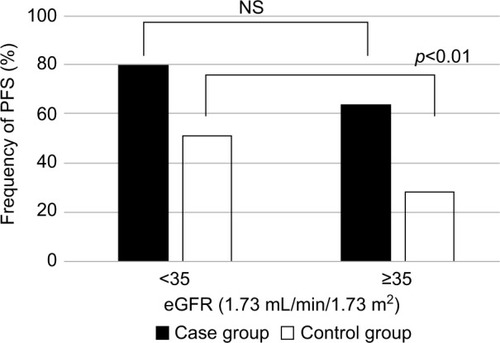
Table 3 Patient characteristics adjusted by age, sex, and renal function using the propensity score analysis
Table 4 Sensitivity, specificity, and positive likelihood ratio of PFS to diagnose acute pyelonephritis after propensity score adjustment for age, sex, and renal function
Table 5 Frequency of causative bacteria