
Figures & data
Figure 1 MRI brain images of this study in orthogonal planes showing measurement annotations and appropriate planes for measurements.
Abbreviation: FLAIR, fluid-attenuated inversion recovery.
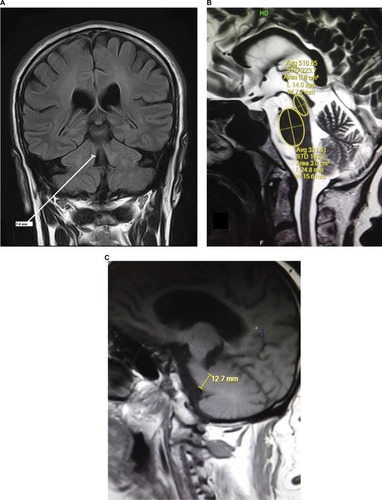
Figure 2 Box plot of P/M ratio in patients with PSP.
Abbreviations: P/M, pons area–midbrain area ratio; PD, Parkinson’s disease; PSP, progressive supranuclear palsy.
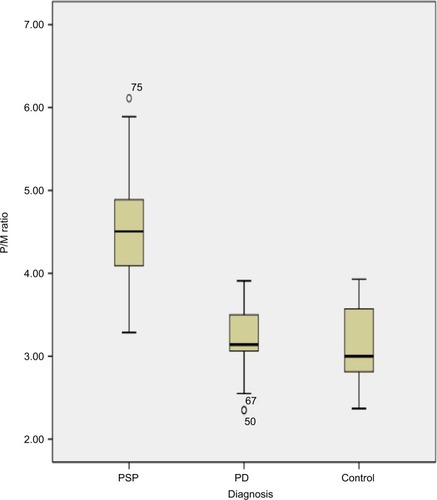
Figure 3 Box plot of MCP/SCP ratio in PSP patients (median =4.75; range, 3.14–6.35), PD patients (median =2.97; range, 1.92–4.77), control participants (median =3.0; range, 2.38–4.29).
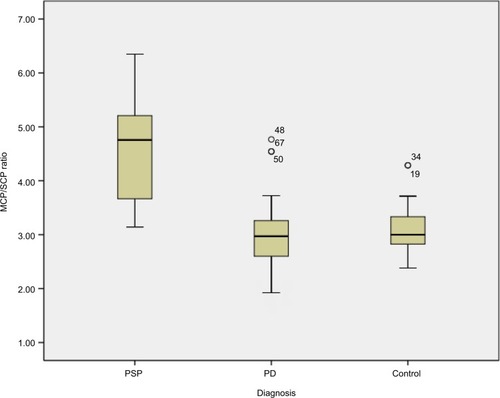
Table 1 Demographic data of PD and PSP patients along with healthy control participants involved in this study
Table 2 MR planimetric measurements in three different subgroups of this study
Figure 4 Box plot of MRPI in PSP patients (median =21; range, 12.92–30.56), PD patients (median =9.5; range, 5.89–14.9), control participants (median =9.6; range, 6.67–14.29). MRPI values are higher in PSP patients compared to PD and HC.
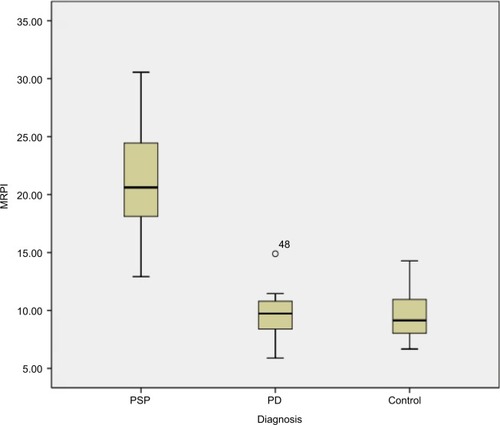
Table 3 Sensitivity and specificity of MRPI for the differentiation of PSP and PD
Table 4 All pairwise multiple comparison procedures taking MRPI values