
Figures & data
Figure 1 Bland-Altman plot of sodium (A) and potassium (B).
Abbreviations: AA, auto-analyzer; ABG, arterial blood gas; SD, standard deviation.
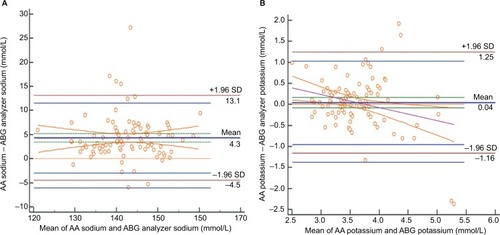
Figure 2 Mountain plot for sodium (A) and potassium (B).
Abbreviations: AA, auto-analyzer; ABG, arterial blood gas.
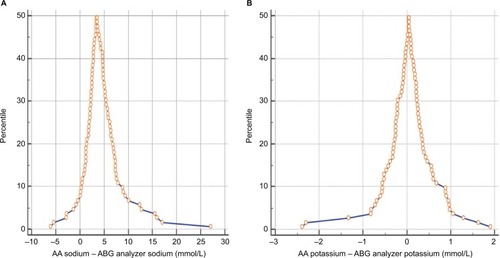
Figure 3 Passing and Bablok regression analysis of sodium (A) and potassium (B).
Abbreviations: AA, auto-analyzer; ABG, arterial blood gas.
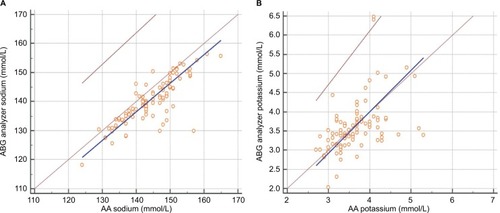
Table 1 Comparision of statistics obtained from AA and ABG analyzer for sodium and potassium