
Figures & data
Table 1 Diagnostic tests and procedures performed
Table 2 Hematological and biochemical profiles of the study cohort
Figure 1 Abdomen ultrasound scanning results: a pie chart showing the types and frequency of pathological findings.
Abbreviations: GB, gallbladder; infart, infarction; 5IHD, type 5 intrahepatic bile duct.
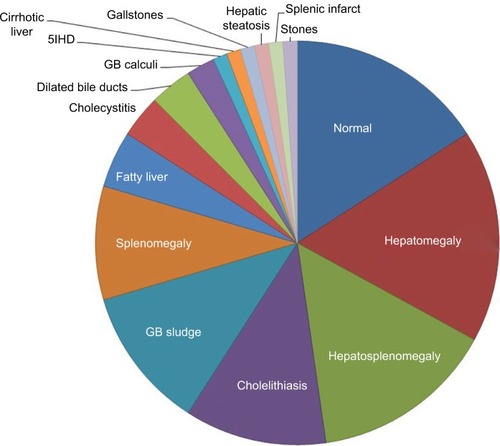
Table 3 Diagnostic tests and procedures performed