
Figures & data
Table 1 Demographic breakdowns of the samples
Table 2 Study 1 – factor analysis using maximum likelihood estimation and oblique rotation
Table 3 Study 1 – reliability using Cronbach’s coefficient alpha based on standardized items
Table 4 Study 2 – bivariate correlationsTable Footnotea
Table 5 Study 2 – mean and one-way analysis of variance results for the HMQ
Table 6 Study 2 – mean and one-way analysis of variance results for the Big Five personality characteristics
Table 7 Kruskal Wallis Results for the Horowitz MSIDS Questionnaire (HMQ) and the Big Five Personality Characteristics for Study 2 and 3
Table 8 Study 2 – discriminant analysis results
Table 9 Study 3–Means and One-Way Analysis of Variance Results for the Horowitz MSIDS Questionnaire
Table 10 Study 3–Discriminant Analysis Results
Figure 1 Migratory symptoms and prediction of healthy vs Lyme status for Studies 2 and 3.
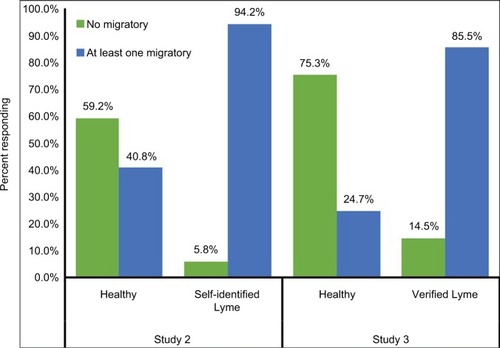
Table 11 MSIDS differential diagnosis of migratory pain