Figures & data
Table 1 Reasons for using TSP as a reference standard during 1H-NMR spectroscopy
Table 2 Previously published studies aiming to identify HCC biomarkers through analysis of urine by 1H-NMR spectroscopy
Figure 1 (A) Unedited 1H-NMR spectra example. Different colors correspond to individual samples overlaid. (B) Median spectra of unedited data for ppm values ranging from above 4.5 to below 9.5. (C) Median spectra of unedited data for ppm values ranging from 1 to 4.5. Numbers indicate the following commonly reported metabolites – 1: lactate; 2: alanine; 3: acetoacetate; 4: carnitine; 5: citrate; 6: creatinine; 7: creatine; 8: TMAO; 9: glycine; 10: hippurate; 11: 1-methylnicotinamide; 12: water; 13: urea; 14: formate.
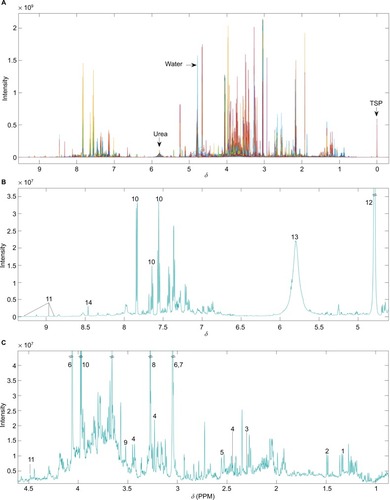
Figure 2 Example of univariance scaled PCA scores plot after data processing using the first and third principal components.
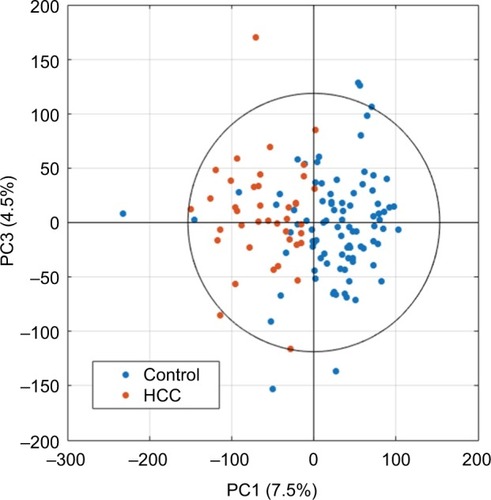
Figure 3 Loading plot from an OPLS-DA model built using HCC and healthy control as disease classes pairwise.
Abbreviations: HCC, hepatocellular carcinoma; OPLS-DA, orthogonal partial least squares discriminant analysis; pFDR, false discovery rate; δ, chemical shift; PPM, parts per million.
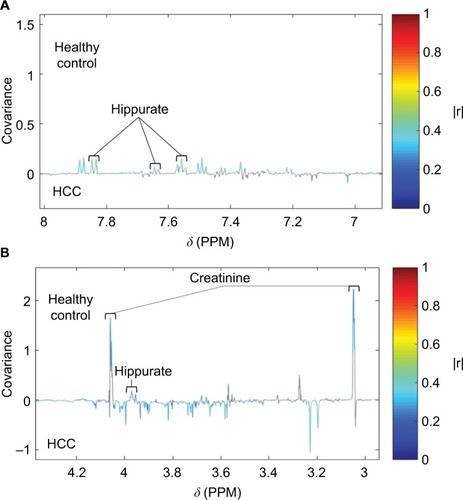
Figure 4 Identification of peaks from the same compound (hippurate) using STORM.Citation50 Significant signals (pFDR<0.05) are shown in colors corresponding to the correlation coefficient (|r|).
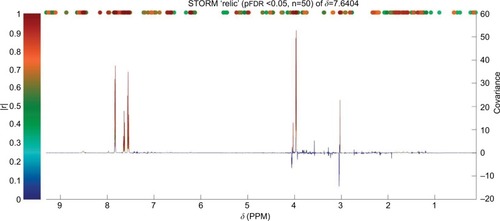
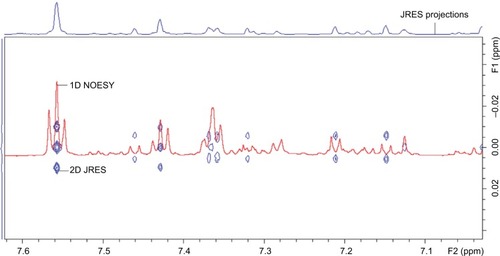
Figure 5 Example of 2D JRES image (blue) with 1D NOESY spectra overlaid (red) used to verify multiplicity.
Abbreviations: JRES, J-resolved spectroscopy; 2D, two-dimensional; 1D, one-dimensional; NOESY, nuclear Overhauser effect spectroscopy; ppm, parts per million.