Figures & data
Table 1 Questionnaire responses from pre-intervention survey of FY1s
Table 2 Comparison of “inappropriate” prescribing tasks submitted during individual pre-intervention weekends with the post-intervention weekends
Figure 1 Bar graph comparing the number of inappropriate prescribing tasks handed over in pre-intervention weekends with post-intervention weekends.
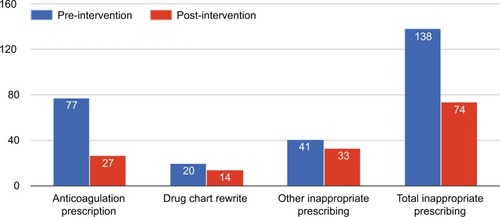
Table 3 Standard deviation calculation for the mean number of inappropriate prescribing tasks as a percentage of total prescribing in pre- and post-intervention weekends
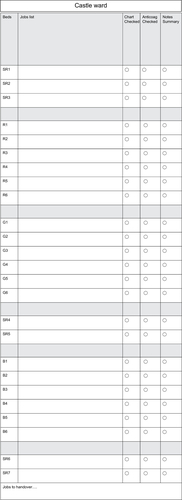
Figure S1 Checklist designed to decrease inappropriate prescribing handed over to junior doctors during out-of-hours.