
Figures & data
Table 1 Population characteristics
Figure 1 Number of blood draws per hospitalization.
Notes: The histogram shows how the blood draws per hospitalization were distributed across the two patient groups, before (light gray) and after (dark gray) implementation of the “Smarter Medicine” recommendation. There is a significant decrease in the number of blood draws after recommendation implementation; P = 0.002 (Mann–Whitney U test).
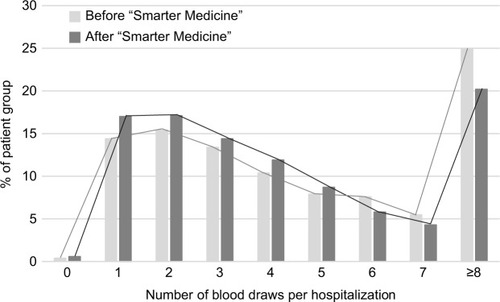
Table 2 Outcomes of “Smarter Medicine” recommendation implementation
Figure 2 Distribution of blood volume drawn per hospitalizations.
Notes: The box plot represents the volume of blood drawn per hospitalization before (light gray) and after (dark gray) implementation of the “Smarter Medicine” recommendation. *Significant difference before and after implementation; P = 0.01 (Mann–Whitney U test). Values above 250 mL are not shown.
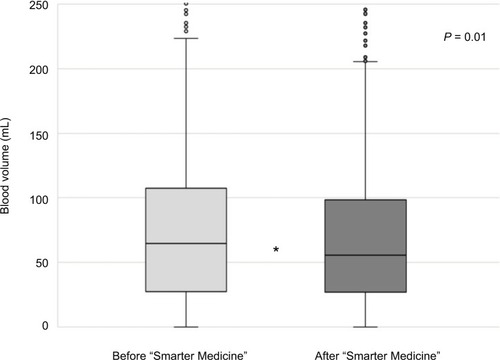
Table S1 Number of blood tubes drawn and volume of blood drawn according to the type of blood tubes