Figures & data
Table 1 Clinical and analytical data for the study groups
Figure 1 Insulin action in the adipocyte: maximal insulin binding and basal and maximal glucose transport after stimulated insulin (10−7 mol/L) in type 1 diabetic patients with >5 years and ≤ of 5 years of diabetes.
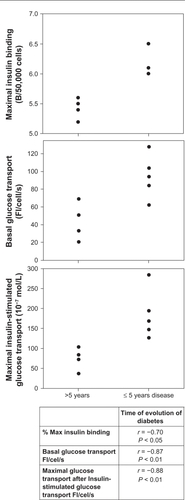
Table 2 Insulin binding, basal glucose transport, and insulin-stimulated glucose transport in adipocytes from type 1 diabetic patients according to duration of disease
Table 3 Correlations between several clinical and analytical parameters and insulin action in adipocyte tissue in type 1 diabetes patients