Figures & data
Table 1 Primers used to amplify region of interest in PCR
Figure 1 DLBS3233 increases glucose uptake in 3T3 Swiss albino cells compared with untreated cells. A) Glucose uptake level of 3T3 Swiss albino preadipocytes and adipocytes in normal and insulin-resistant condition. B) Effect of DLBS3233 5 μg/mL and pioglitazone 0.02 μM on glucose uptake in normal and insulin-resistant 3T3 Swiss albino adipocytes. C) DLBS3233 5 μg/mL enhances glucose uptake activity of 3T3 Swiss albino insulin-resistant adipocytes as potently as pioglitazone in time-dependent manner. Results are mean value ± standard deviation of two independent experiments.
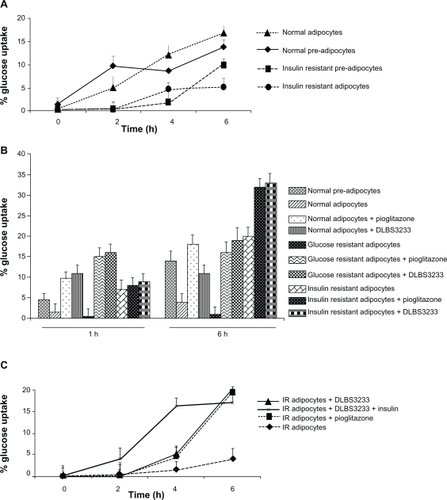
Figure 2 Peroxisome proliferator-activated receptor gamma gene expression after administration of Cinnamomum burmanii extract (A), Lagestroemia speciosa extract (B), and DLBS3233 (C) at various concentrations.
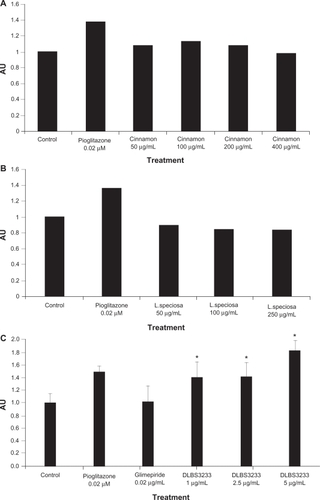
Figure 3 Effect of DLBS3233 5 μg/mL on expression of tyrosine phosphorylation (A). The effect of DLBS3233 5 μg/mL and pioglitazone 0.02 μM in enhancing phosphatidylinositol-3 kinase (B) and Akt (C) gene expression in 3T3 Swiss albino preadipocytes. The effect of DLBS3233 1–5 μg/mL in enhancing glucose transporter 4 gene expression in 3T3 Swiss albino preadipocytes (D). Effect of DLBS3233 and pioglitazone with or without insulin in enhancing glucose transporter 4 gene expression (E), and also total glucose transporter 4 protein level (F).
Abbreviation: AU, arbitrary unit.
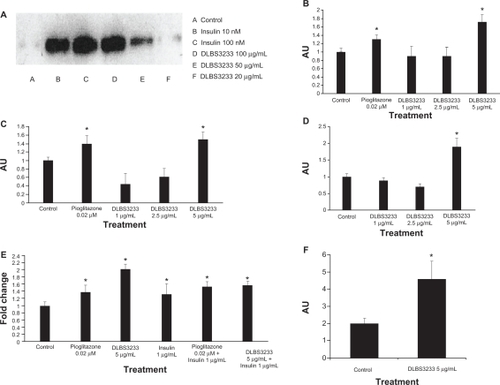
Figure 4 DLBS3233 increases transcription level of adiponectin (A), and decreases transcription level of resistin (B) in 3T3 Swiss albino preadipocytes.
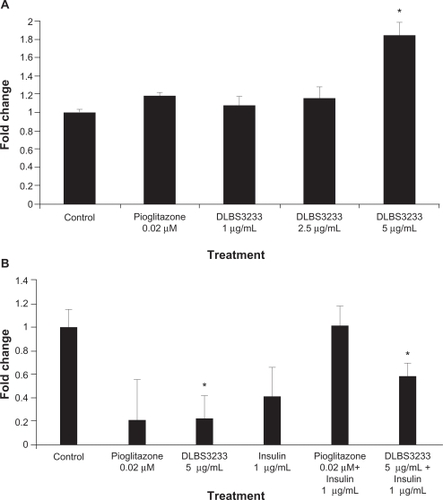
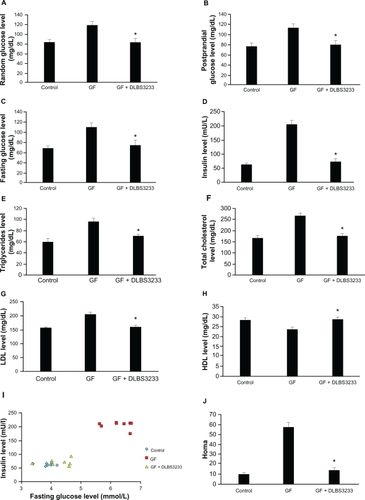
Figure 5 Effect of DLBS3233 9 mg/kg body weight on the levels of glucose (A), postprandial glucose (B), fasting glucose (C), insulin (D), triglycerides (E), total cholesterol (F), low-density lipoprotein (G), and high-density lipoprotein (H) in insulin-resistant Wistar rats, and comparison of fasting glucose and insulin level (I) and further expressed as homeostasis model assessment (J).
Abbreviation: GF, glucose and fructose.