
Figures & data
Table 1 Summary of demographic baseline characteristics of the efficacy population
Figure 1 Evaluation of the difference from baseline of hemoglobin concentrations throughout the study.
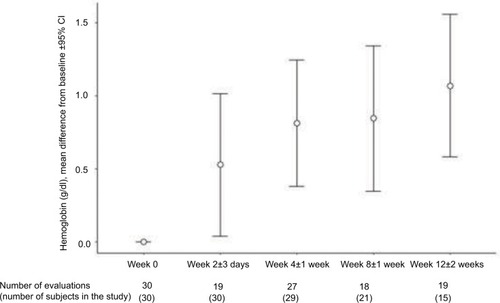
Table 2 Hemoglobin, other hemogram parameters and iron status parameters at baseline, at the end of the study and the corresponding absolute change