Figures & data
Table 1 Demographic and clinical characteristics of the patients and controls
Table 2 Comparison of PDMPs, cytokines, and soluble factors between the patients and controls
Table 3 Correlations of PDMPs and sP-selectin with cytokines in sepsis and HM patients with DIC
Figure 1 Plasma concentrations of PDMPs, HMGB1, IL-6, and TPO before and after ATIII or rTM treatment of DIC patients.
Notes: Between-group comparisons were analyzed using the Newman–Keuls and Scheffe’s tests. Bars show the mean ± SD. 0: before; d: day (after), P-values are for comparison with each baseline parameter (0 vs 7 days, 14 days, and 21 days).
Abbreviations: ATIII, antithrombin III; DIC, disseminated intravascular coagulation; HM, hematologic malignancy; HMGB1, high mobility group box 1; IL-6, interleukin-6; NS, not significant; PDMP, platelet-derived microparticle; rTM, recombinant thrombomodulin; TPO, thrombopoietin.
Abbreviations: ATIII, antithrombin III; DIC, disseminated intravascular coagulation; HM, hematologic malignancy; HMGB1, high mobility group box 1; IL-6, interleukin-6; NS, not significant; PDMP, platelet-derived microparticle; rTM, recombinant thrombomodulin; TPO, thrombopoietin.
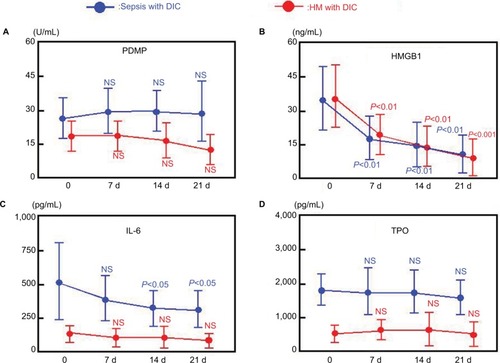
Figure 2 Plasma concentrations of sP-selectin, sE-selectin, sL-selectin, and sVCAM-1 before and after ATIII or rTM treatment of DIC patients.
Notes: Between-group comparisons were analyzed using the Newman–Keuls and Scheffe’s tests. Bars show the mean ± SD. 0: before; d: day (after), P-values are for comparison with each baseline parameter (0 vs 7 days, 14 days, and 21 days).
Abbreviations: ATIII, antithrombin III; DIC, disseminated intravascular coagulation; HM, hematologic malignancy; NS, not significant; rTM, recombinant thrombomodulin; sP-selectin, soluble P-selectin; sE-selectin, soluble E-selectin; sL-selectin, soluble L-selectin; sVCAM-1, soluble vascular cell adhesion molecule-1.
Abbreviations: ATIII, antithrombin III; DIC, disseminated intravascular coagulation; HM, hematologic malignancy; NS, not significant; rTM, recombinant thrombomodulin; sP-selectin, soluble P-selectin; sE-selectin, soluble E-selectin; sL-selectin, soluble L-selectin; sVCAM-1, soluble vascular cell adhesion molecule-1.
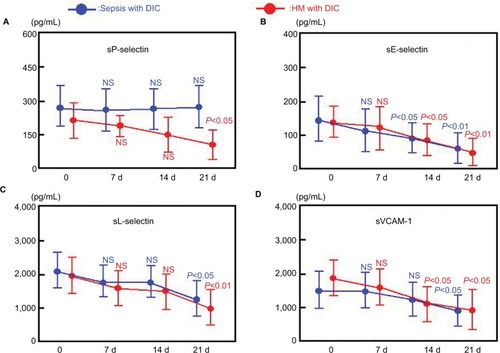
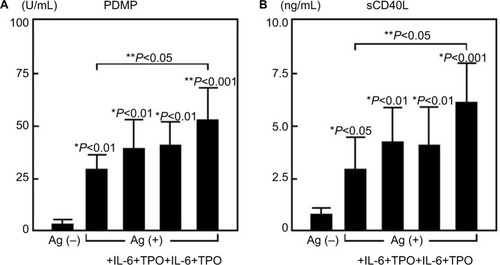
Figure 3 Study of platelet activation by agonists and cytokines.
Notes: Between-group comparisons were analyzed using the Newman–Keuls and Scheffe’s tests. Bars show the mean ± SD. These biomarkers were equally distributed. *P-values are for comparison with each baseline parameter (Ag (−) vs Ag (+)). **P-values are for comparison between 2 parameters (Ag (+) and cytokine (−) vs Ag (+) and IL-6 or TPO).
Abbreviations: Ag, agonist; PDMP, platelet-derived microparticle; sCD40L, soluble CD40 ligand; IL-6, interleukin-6; TPO, thrombopoietin.
Abbreviations: Ag, agonist; PDMP, platelet-derived microparticle; sCD40L, soluble CD40 ligand; IL-6, interleukin-6; TPO, thrombopoietin.