Figures & data
Table 1 Physiological and metabolic characteristics of the four experimental groups
Figure 1 Liver weight of the animals at the end of the experiment in four groups: chow-fed (C), vehicle (V), diet-to-chow (DC), and fenofibrate treated (F).
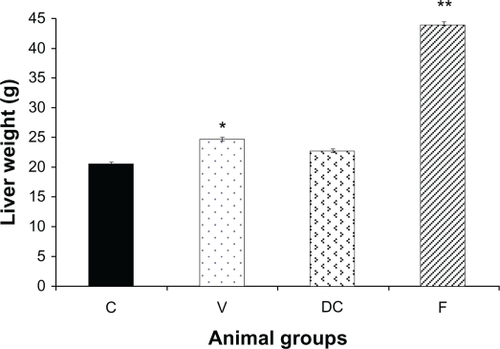
Figure 2 Content of hepatic triglycerides (TG) in four experimental groups: chow-fed (C), vehicle (V), diet-to-chow (DC), and fenofibrate treated (F).
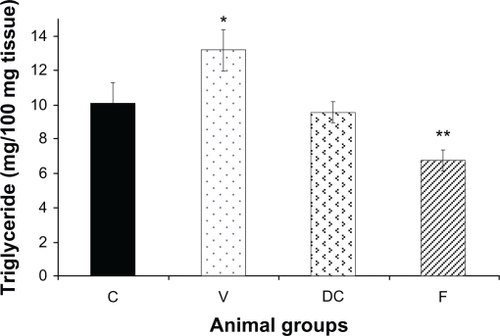
Figure 3 Protein expression of A) IR-β, and B) IRS-1 in rat liver. Equal amounts (50 μg/well) of protein were separated by SDS-PAGE and immunoblotted with IR-β or IRS-1 antibodies, respectively. The animal groups are: C) chow-fed lean control, V) vehicle group (untreated dietary obese), DC (diet-to-chow group), and F) fenofibrate treated group.
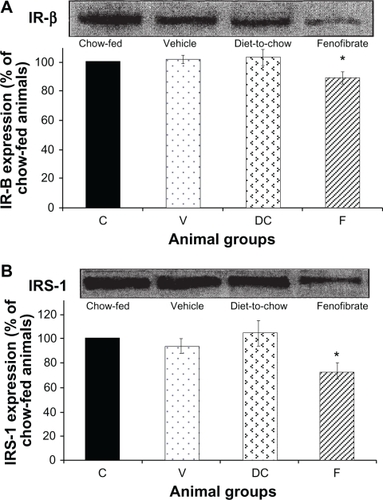
Figure 4 Protein expression of A) IRS-2 and B) PI 3-kinase in rat liver. Equal amounts (50 μg/well) of protein were separated by SDS-PAGE and immunoblotted with IRS-2 and PI 3-kinase antibodies, respectively. The animal groups are: C) chow-fed lean control, V) vehicle group (untreated dietary obese), DC) diet-to-chow group, of the control group and expressed as a percentage of chow fed (control) rats.
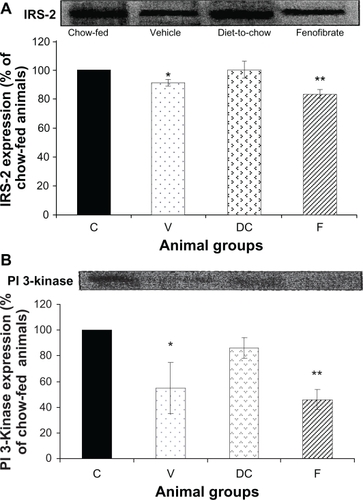
Figure 5 Protein expression of AKt in rat liver. Equal amounts (50 μg/well) of protein were separated by SDS-PAGE and immunoblotted with AKt antibody. The animal groups are: C) chow-fed lean control, V) vehicle group (untreated dietary obese), DC) diet-to-chow group, and F) fenofibrate treated group.
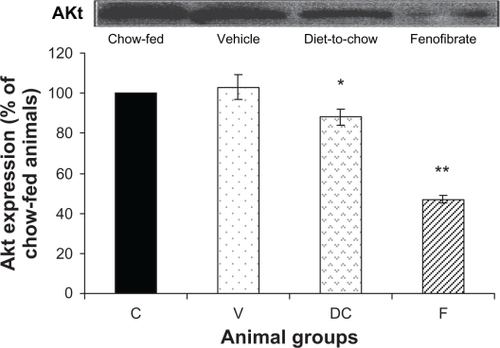
Figure 6 Protein expression of eNOS in rat liver. Equal amounts (50 μg/well) of protein were separated by SDS-PAGE and immunoblotted with eNOS antibody. The animal groups are: C) chow-fed lean control, V) vehicle group (untreated dietary obese), DC) diet-to-chow group, and F) fenofibrate treated group.
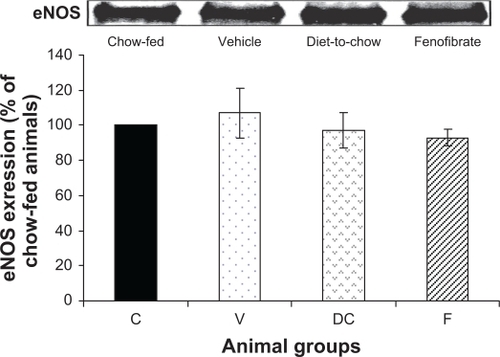
Figure 7 Protein expression of A) Shc and B) ERK1/2 in rat liver. Equal amounts (50 μg/well) of protein were separated by SDS-PAGE and immunoblotted with Shc or ERK 1/2 antibodies, respectively. The animal groups are: C) chow-fed lean control, V) vehicle group (untreated dietary obese), DC) diet-to-chow group, and F) fenofibrate treated group.
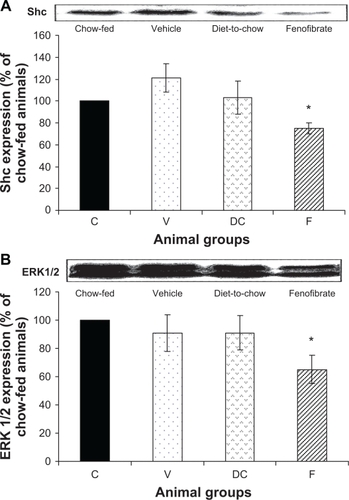
Figure 8 Histologic sectioning for the liver: A) normal liver, B) steatosis fatty liver grade one, C) steatosis fatty liver grade two and D) steatohepatitis grade one. Note: The arrows indicate the presence of adipocytes in each section.
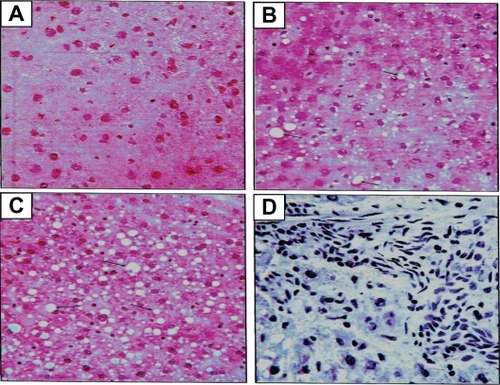
Table 2 Total percentage of hepatic change (steatosis) in stage 1 of non-alcoholic fatty liver disease in the four experimental groups
Table 3 Percentage of hepatic inflammation in stage II of non-alcoholic fatty liver disease in the four experimental groups