Figures & data
Table 1 Patient characteristics
Table 2 Inflammatory index values in NSCLC at different stages and in control group
Figure 1 Comparison of area under the ROC curve of inflammatory markers in response evaluation.
Abbreviations: WBC, white blood cell; PLT, platelet; NLR, neutrophil to lymphocyte ratio, MLR, monocyte to lymphocyte ratio; PLR, platelet to lymphocyte ratio; ROC, receiver operating characteristic.
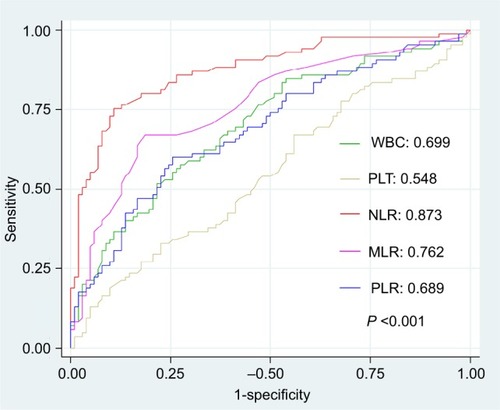
Table 3 Optimal cutoff point of each study marker, sensitivity, specificity and AUC values in predicting response to EGFR TKI
Table 4 Estimation of PFS and prognosis markers for NSCLC patients
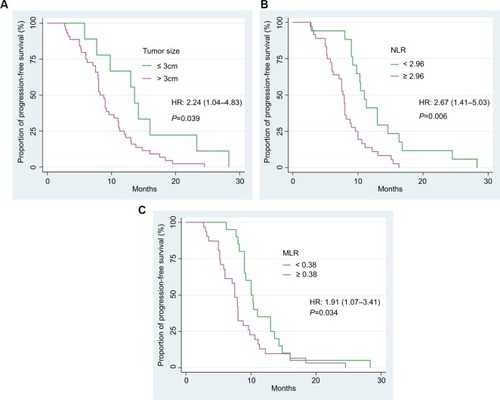
Figure 2 Progression-free survival of NSCLC patients according to the tumor size (A), the pretreatment levels of NLR (B), and MLR (C).
Abbreviations: NLR, neutrophil to lymphocyte ratio; MLR, monocyte to lymphocyte ratio; NSCLC, non-small cell lung cancer.