Figures & data
Table 1 Percent severity ratings before dapsone and with dapsone combination therapy
Table 2 Frequency and percentage of positive CDC IgG and IgM Western blots with positive bands 31 and 34 kDa and a negative ELISA or negative C6 ELISA
Table 3 Babesia subtypes by demographic region in 200 Lyme disease patients
Figure 1 Percentage of 200 patients with IgM Western blot band(s) over the course of treatment.
Abbreviation: IgM, immunoglobulin M.
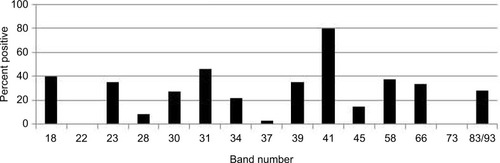
Figure 2 Percentage of 200 patients with IgG Western blot band(s) over the course of treatment.
Abbreviation: IgG, immunoglobulin G.
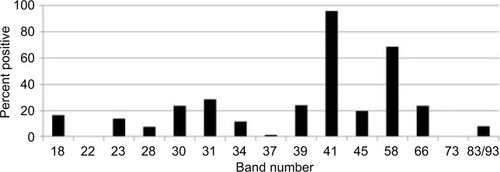
Figure 3 Percentage of patients with EM rashes and positive Lyme testing.
Abbreviations: CDC, Centers for Disease Control and Prevention; EM, erythema migrans; IFA, immunofluorescent antibody; IgM, immunoglobulin M; LTT, lymphocyte transformation test.
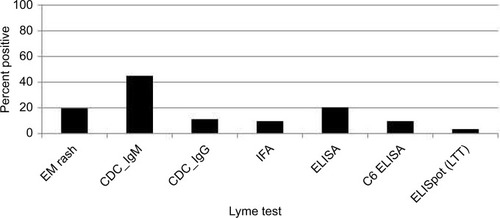
Figure 4 Percent positive testing for coinfections over the course of treatment among 200 Lyme disease patients. These results demonstrate a high percentage of co-infections.
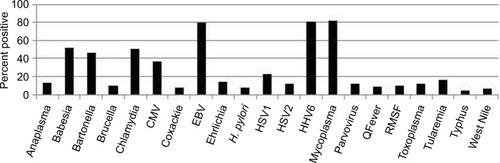
Figure 5 Indirect and direct Babesia diagnostic testing among 200 patients with Lyme disease.
Abbreviations: FISH, fluorescent in situ hybridization; PosGi, positive Giemsa.
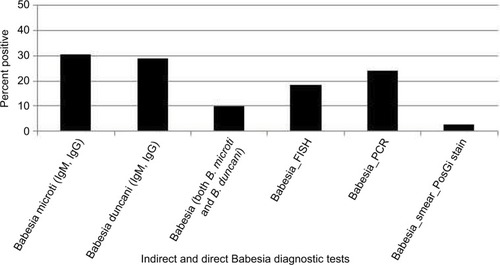
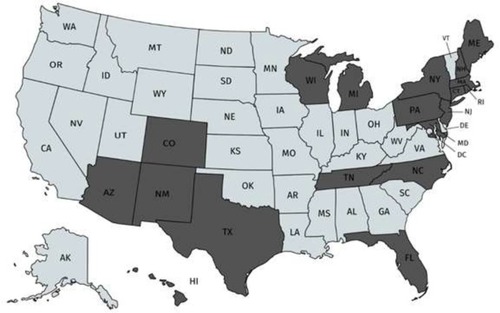
Figure 6 Antibody-positive Babesia duncani cases by home state in 200 patients.