Figures & data
Figure 1 The standard deviation of lateral position (SDLP).
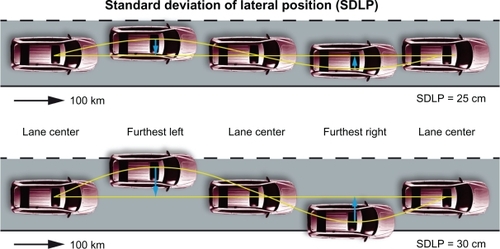
Figure 2 One of the instrumented cars of Utrecht University.
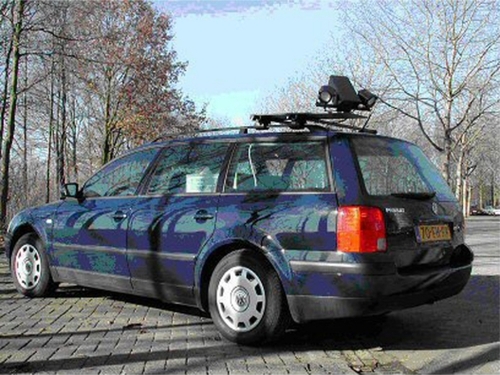
Figure 3 Schematic representation of the on-the-road driving test.
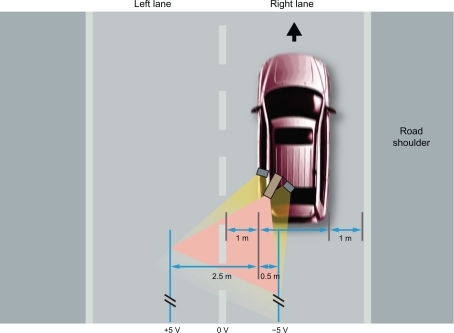
Figure 4 Examples of lateral position and speed changes over distance traveled. Adapted with permisison from Volkerts ER, de Vries G, Meijer T, et al. Driving performance the day after use of loprazolam, flunitrazepam and placebo. VSC, Report VK 83-04, Traffic Research Centre, Groningen, The Netherlands, 1984.Citation11
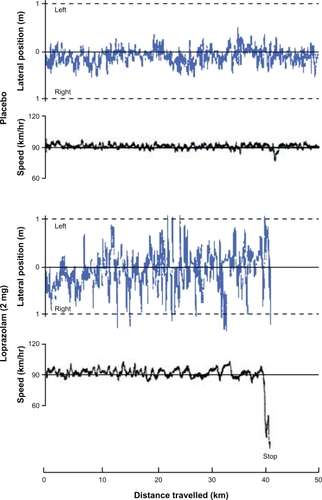
Figure 5 Standard operation procedures to edit the raw data of the driving test. The top figure shows the mean lateral position (MLP) of the car. The bottom figure shows the mean speed (MS) of the car. Standard operation procedures: A) Start of the test: data is deleted until the subject drives 95 km/h in gear number 5. B) An overtaking maneuver: data is deleted from the start of accelerating to overtake, or moving to the left lane, until the car is returned completely back on the right lane and its speed is returned to 95 km/hour. C) Attempt to overtake: data is deleted from the first attempt to overtake. D) Between two overtaking maneuvers: data is deleted when the distance between the two maneuvers is at less than 600 meters. E) Out of the detection range: data is deleted. F) Collisions, off road crashes, other events requiring stopping or slowing speed: data is deleted from the moment of the crash until the car drives 95 km/hour in gear number 5. Cut-off points for editing are indicated by |.
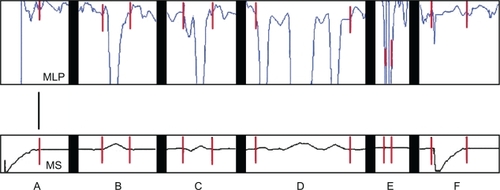
Figure 6 SDLP values obtained after administration of placebo.
Data from references Citation2, Citation12–Citation24.
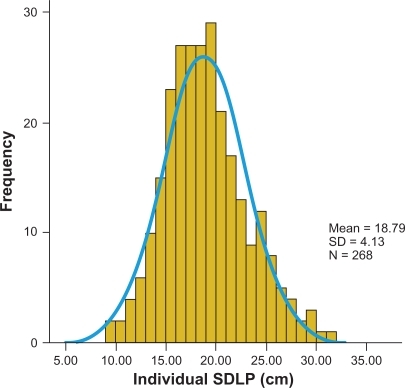
Figure 7 Test–retest reliability of SDLP measurement.
Data from n = 98 healthy volunteers (data from references Citation2, Citation12–Citation18).
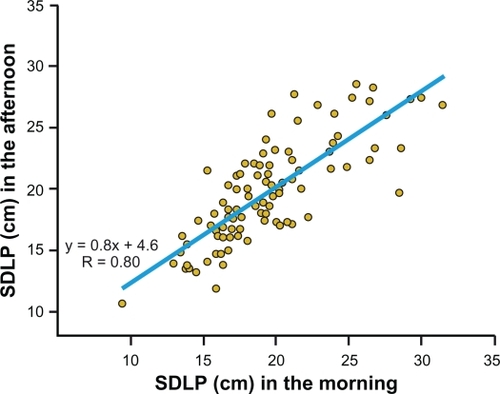
Figure 8 SDLP values and weather conditions.
Data from 174 driving tests of healthy volunteers who received placebo treatment (Data from references Citation21–Citation23, Citation25).
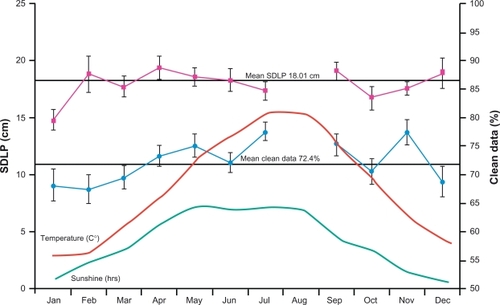
Table 1 Data from one driving test, when using different length of segments
Figure 9 SDLP values over distance traveled. The left Figure shows SDLP values calculated for 10 km segments of 214 subjects who drove after receiving placebo (Data from references Citation11, Citation12, Citation17, Citation18, Citation22, Citation23). The right panel shows SDLP values obtained after 1, 4, and 8 hours of continuous driving (Data from reference Citation27).
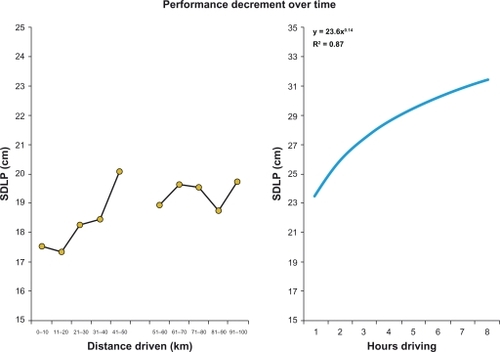
Figure 10 The impact of mean lateral position changes on SDLP.
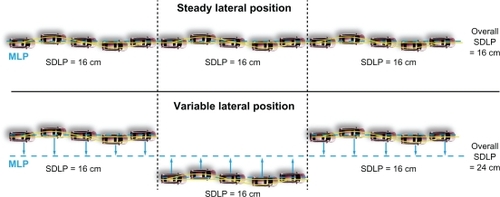
Figure 11 Subjective assessments completed after the driving test. Subjects indicate their perceived driving quality (left figure) and perceived effort (right figure) by placing an ‘X’ at the vertical line.
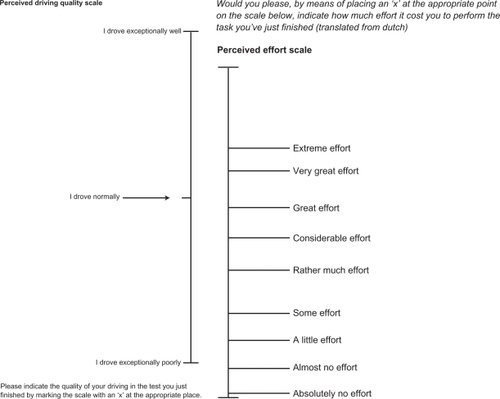
Figure 12 SDLP differences from placebo (cm) after administration of flurazepam (30 mg). When absolute placebo SDLP values increase, the difference from placebo does not (r = 0.16, n.s.).
Data from reference Citation3, Citation15.
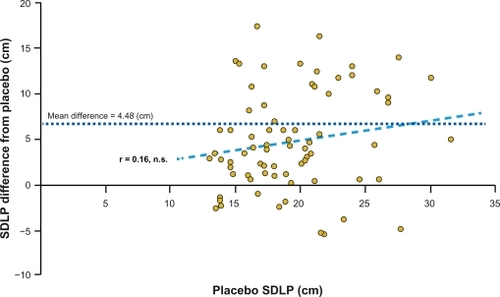
Table 2 Summary of generally observed differences and similarities between the on-the-road driving test, driving simulators, and psychometric tests