Figures & data
Table 1 Comparison between gender of atopy prevalence and percentage of atopic cases having eczema based on 3 mm cutoff (405 males and 445 females)
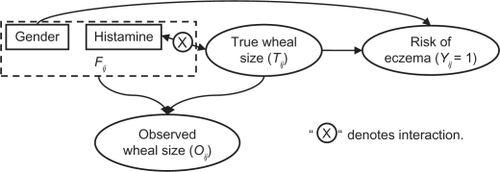
Figure 1 Conceptual structure of the joint model.
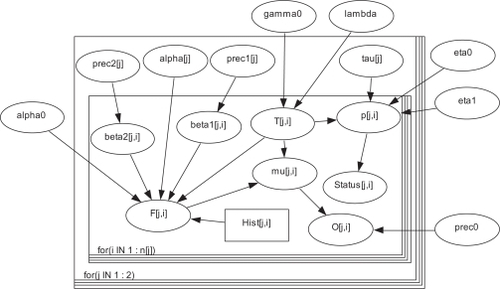
Appendix Figure 1 The detailed structure of the Bayesian joint model.
Appendix Figure 2 The WinBUGS program corresponding model structure in .
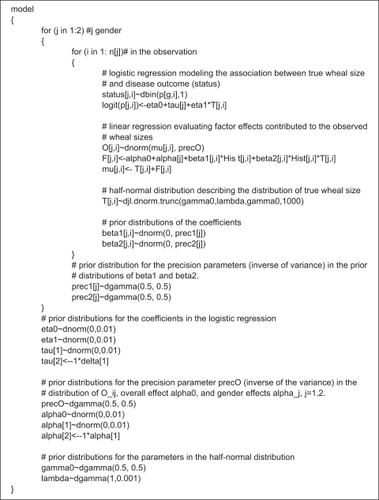
Table 2 Summary of observed and inferred wheal sizes and proposed cutoff values (The unit of each variable is in millimeters. Standard deviations are in the parentheses)
Figure 2 The relationship between sensitization prevalence of wheat and cutoff value based on Tij.
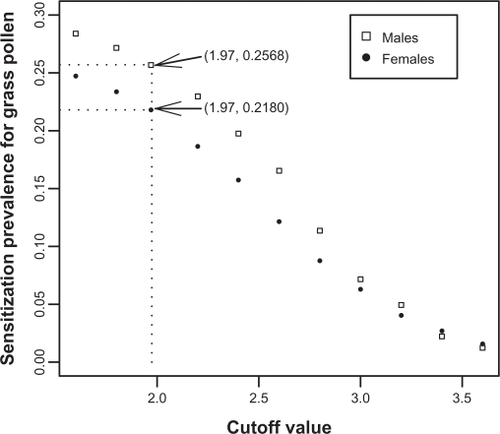
Table 3 Cutoff values and sensitization prevalence comparison between gender based on Tij
Table 4 Eczema cases with positive sensitization based on Tij
Table 5 Comparison of prevalence between gender based on
of sensitization and percentage of atopic cases having eczema
Table 6 Comparison of prevalence between gender of atopy and percentage of atopic cases having eczema based on different cutoffs on all allergens