Figures & data
Table 1 Baseline Characteristics of the Included Patients
Table 2 Correlation Between PTH, Ph Levels and Vascular Calcification
Table 3 Correlation Between CRP and Vascular Calcification
Table 4 Multivariate Analysis of Vascular Calcification, CRP, PTH, and Ph Levels
Figure 1 Correlation between anemia and left ventricular hypertrophy.
Abbreviation: LVH, left ventricular hypertrophy.
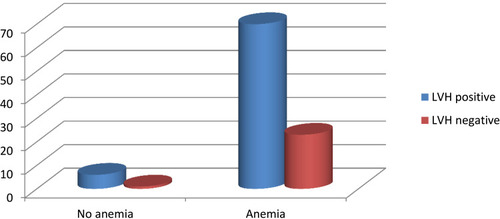
Table 5 Cardiovascular Causes of Death
Figure 2 Causes of first-year mortality of all studied patients.
Abbreviation: CVD, cardiovascular diseases.
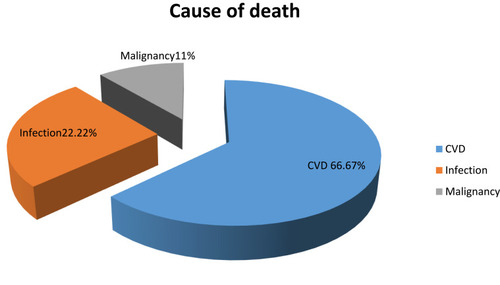
Table 6 ECHO and ECG Finding of All Studied Patients
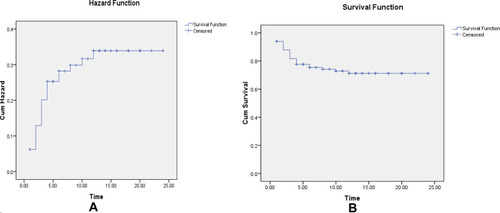
Figure 3 (A and B) Survival analysis of the studied group using Kaplan–Meier, mean survival time is 18.186 months.