Figures & data
Table 1 Age, Socioeconomic Characteristics, Lifestyle, M.I.N.I, BDI-II and the MADRS-S Scores of the Participants Included in the Study
Figure 1 Flow-chart over the inclusion, where 33 persons were excluded from the study and further six persons missed one or more questions of MADRS-S and/or BDI-II.
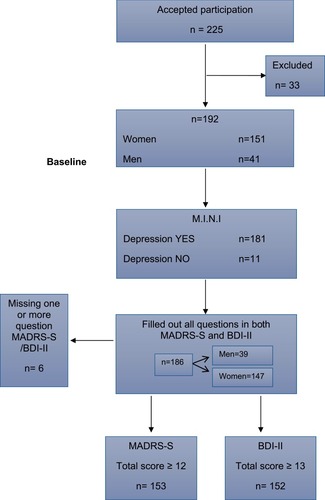
Table 2 Number and Percentage of Patients Identified with Depression by BDI-II and MADRS-S When Using M.I.N.I. As Gold Standard
Table 3 Sensitivity and Specificity for BDI-II and MADRS-S, Respectively, with M.I.N.I. Used as Gold Standard
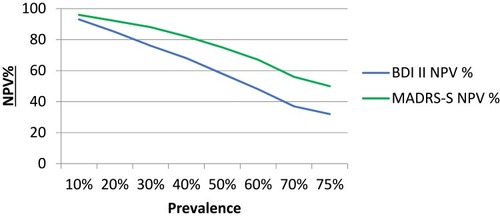
Table 4 NPV and PPV Values Calculated from Different Prevalences Ranging Between 10% and 75% for BDI-II and MADRS-S Variables
Figure 2 Linear diagram for PPV values calculated from different prevalences ranging between 10% and 75% for BDI-II and MADRS-S variables.
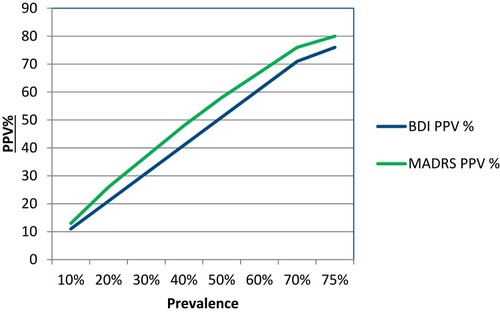
Figure 3 Linear diagram for NPV values calculated from different prevalences ranging between 10% and 75% for BDI-II and MADRS-S variables.