
Figures & data
Table 1 Baseline Demographic and Clinical Characteristics of Patients with HCV-Related Chronic Liver Disease
Table 2 Distribution of Serum Methylated P16 Levels Among Healthy Controls and Cases
Figure 1 Comparison between serum methylated p16 levels among different groups (healthy controls and HCV-related chronic liver disease).
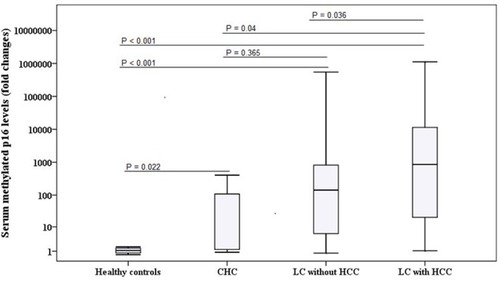
Figure 2 Comparison between serum methylated p16 levels among different groups (HCC cases and non-HCC cases).
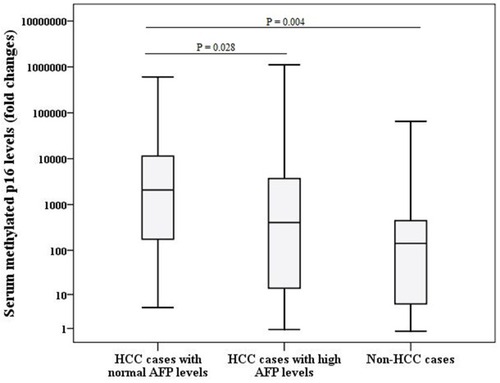
Figure 3 Area under the receiver operating characteristic curves (AUC) of (A) methylated p16 [AUC= 0.7; 95% CI (0.580–0.772)] for predicting HCC versus non-HCC, (B) combination of methylated p16 and AFP [AUC= 0.872; 95% CI (0.742–0.951)] for predicting HCC versus non-HCC, and (C) methylated p16 [AUC= 0.823; 95% CI (0.694–0.942)] for predicting HCC in patients with hepatic mass and normal AFP versus non-HCC cases.
![Figure 3 Area under the receiver operating characteristic curves (AUC) of (A) methylated p16 [AUC= 0.7; 95% CI (0.580–0.772)] for predicting HCC versus non-HCC, (B) combination of methylated p16 and AFP [AUC= 0.872; 95% CI (0.742–0.951)] for predicting HCC versus non-HCC, and (C) methylated p16 [AUC= 0.823; 95% CI (0.694–0.942)] for predicting HCC in patients with hepatic mass and normal AFP versus non-HCC cases.](/cms/asset/d5aece4b-bc4f-401a-84cb-4e43dcc6ca6a/dijg_a_249272_f0003_b.jpg)