
Figures & data
Figure 1 Detection of the Ile105Val (A to G transition) of GSTP1 by RFLP on 2% agarose gel. (M) 100 bp DNA ladder (CinnaGen co, Iran); lane 1: GSTP1 (Val/Val), lane 2: GSTP1 (Ile/Val); lane 3: GSTP1 (Ile/Ile).
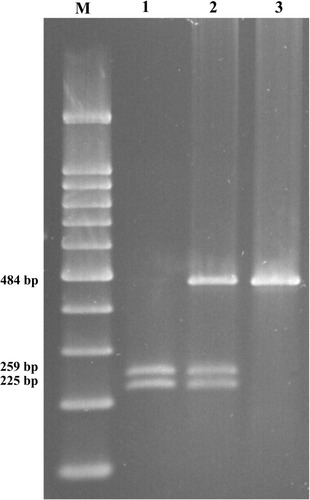
Figure 2 Multiplex PCR products electrophoresed on 2% agarose gel. (M) 100 bp DNA ladder (CinnaGen co, Iran); lane 1: GSTM1 null & GSTT1 present; lanes 2 and 4: GSTM1 & GSTT1 present; lane 3: GSTM1 & GSTT1 null; lanes 5 and 6: GSTM1 present & GSTT1 null.
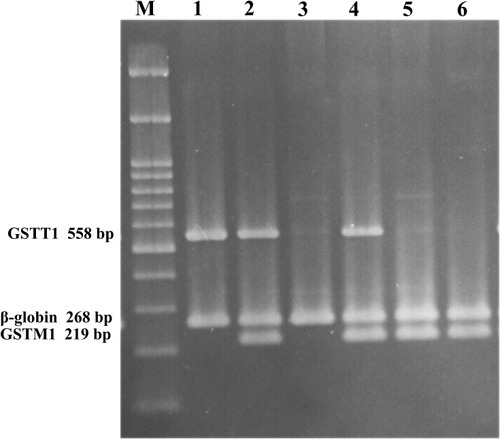
Table 1 Clinical Parameters of the Patients and Controls
Table 2 GST Genotypes and the Risk of Coronary Artery Disease
Table 3 Distribution of the GST Genotypes Stratified by the Severity of Coronary Artery Disease
Table 4 Combined Effects of GSTM1, GSTT1, and GSTP1 Polymorphisms in the Study Subjects
Table 5 Combination of Double GST Polymorphisms
Table 6 Interaction of the GST Genotypes and Coronary Artery Disease (CAD) Risk Factors on CAD Development
Table 7 Summary of Multifactor Dimensionality Reduction Gene–Gene Interaction Result
Figure 3 A summary of the best gene–gene interaction analysis by multifactor dimensionality reduction for 12 genotypes (GSTP, GSTM, and GSTT genes) associated with coronary artery disease. The dark shading box represents high-risk combinations and the light shading box shows low-risk combinations. In each box, the left and right columns represent the percentage of the cases and controls, respectively.
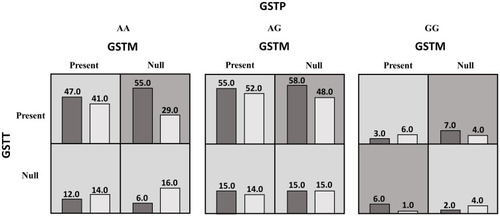
Table 8 Summary of Multifactor Dimensionality Reduction Gene–Environment Interaction Results