Figures & data
Figure 1 Semi-quantitative analysis procedure to determine the presence of VSC. Color changes indicating higher concentration of sulfhydryls.
Abbreviations: VSC, volatile sulfur compounds; VSCI, volatile sulfur compound indicator.
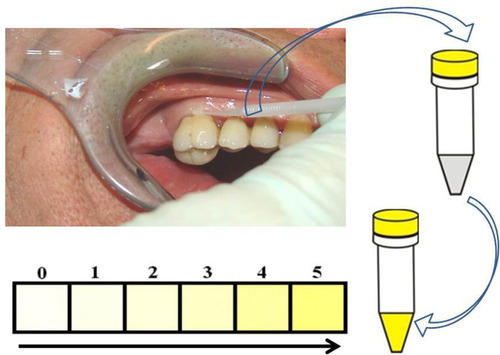
Figure 2 In the dental clinic: From left to right: (A) Local measurement of toxins in the sulcus of the RFT with the VSCI (here, grade 5); (B) extraction of the RFT; (C) place the RFT in Aqua-Bidest for 24 hours at room temperature.
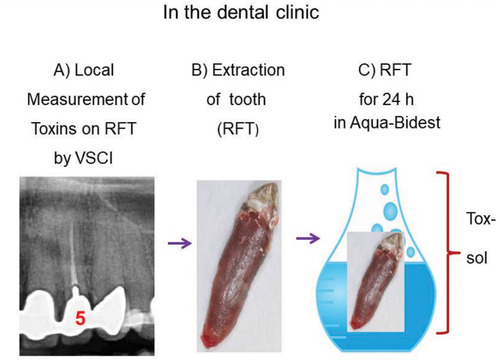
Figure 3 In the Laboratory serum obtained of patient: (D) Exposure of the heparinized whole blood of the patient with the RFT extraction toxin solution (Tox-sol) for 24 hours; (E) measurement of the ATP supply after 24 hours in contaminated blood plus RFT dilution; (F) heparinized whole blood of the patient without the extraction toxin solution (Tox-sol); (G) control measurement of the ATP supply after 24 hours in pure Aqua-Bidest without the extraction toxin solution (Tox-sol).
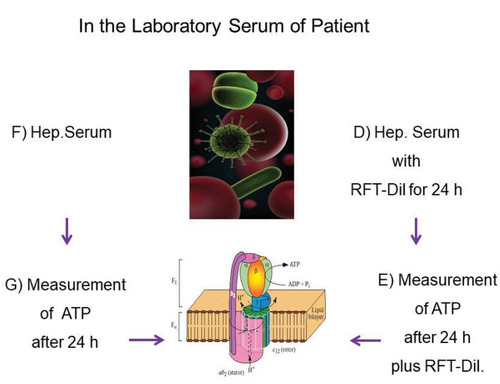
Figure 4 Sample PBMC measurement results using JC-10 dye.
Abbreviation: PBMC, peripheral blood mononuclear cell.
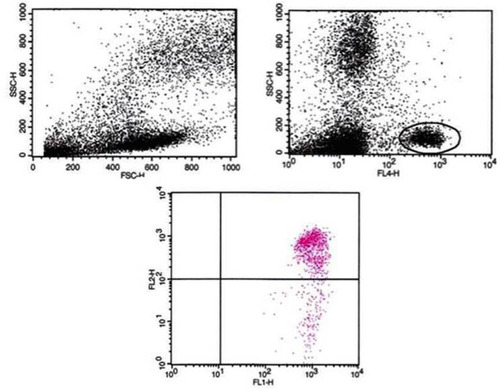
Figure 5 Overview of ATP activity in the two test subjects, each of whom was exposed to a solution containing a healthy wisdom tooth. Y-axis is percentage of T cells (CD3+) without a reduction in the membrane potential. This unrestricted membrane potential is also referred to as ATP energy level (see ).
Abbreviations: h, hours; ATP, adenosine triphosphate; Tox-sol, toxin solution; VSCI, volatile sulfur compound indicator.
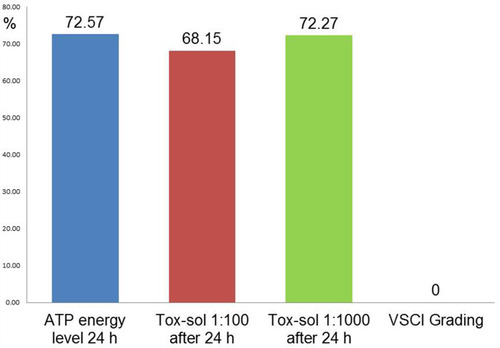
Figure 6 ATP activity on the mitochondrial membrane in five healthy participants after adding the extraction solution in various concentrations (1:100, 1:1000, 1:10,000) and following exposure for 24 hours. Orange box indicates the minimum ATP activity after adding the 1:100 solution compared to other dilutions.
Abbreviations: h, hours; ATP, adenosine triphosphate; Tox-sol, toxin solution.
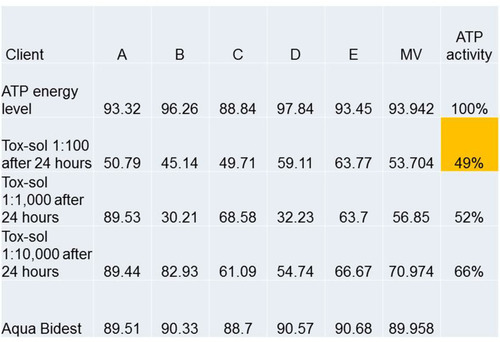
Table 1 Overview of the ATP Activity in 30 Subjects from Four Disease Groups (Rheumatism, Allergies, Neurological Disorders, and Tumors)
Figure 7 ATP activity following 24 hours of exposure to different Tox-sol dilutions. Y-axis is percentage of T cells (CD3+) without a reduction in the membrane potential. This unrestricted membrane potential is also referred to as ATP energy level (see ).
Abbreviations: h, hours; ATP, adenosine triphosphate; Tox-sol, toxin solution.
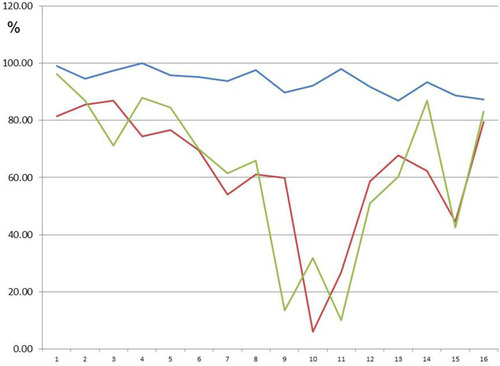
Figure 8 All three ATP activity curves show approximate congruence, so there is unrestricted ATP activity by the Tox-sol in 16 test subjects.
Abbreviations: h, hours; ATP, adenosine triphosphate; Tox-sol, toxin solution.
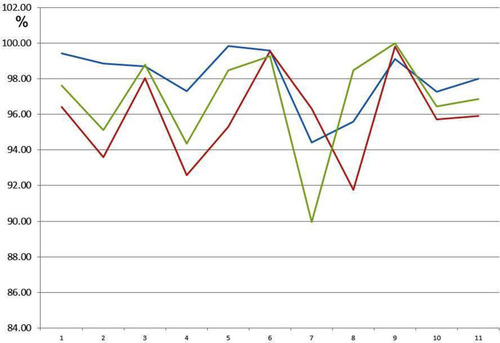
Figure 9 Paradoxically increased ATP activity despite exposure to the Tox-sol in a group of four patients.
Abbreviations: h, hours; ATP, adenosine triphosphate; Tox-sol, toxin solution.
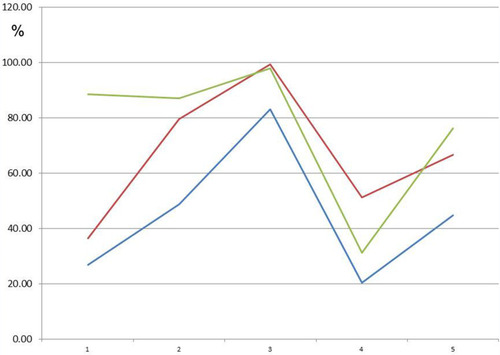
Figure 10 Overview of the mean ATP activity in all groups.
Abbreviations: h, hours; ATP, adenosine triphosphate; Tox-sol, toxin solution; VSCI, volatile sulfur compound indicator.
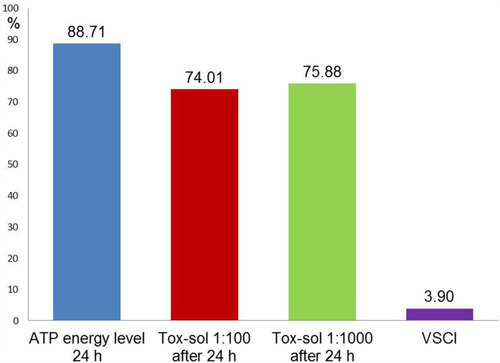
Figure 11 Mean ATP activity values based on a reduction in the maximum ATP activity levels among all groups.
Abbreviations: h, hours; ATP, adenosine triphosphate; Tox-sol, toxin solution; VSCI, volatile sulfur compound indicator.
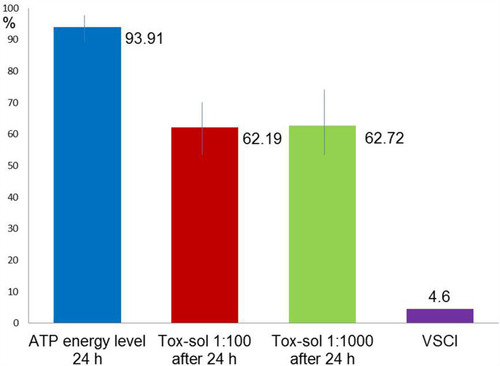
Figure 12 Mean ATP activity levels among the samples that demonstrated no reduction in ATP activity.
Abbreviations: h, hours; ATP, adenosine triphosphate; Tox-sol, toxin solution; VSCI, volatile sulfur compound indicator.
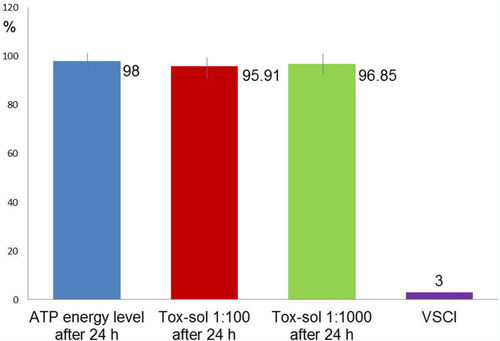
Figure 13 Mean ATP activity levels of the samples that demonstrated a paradoxical increase.
Abbreviations: h, hours; ATP, adenosine triphosphate; Tox-sol, toxin solution; VSCI, volatile sulfur compound.
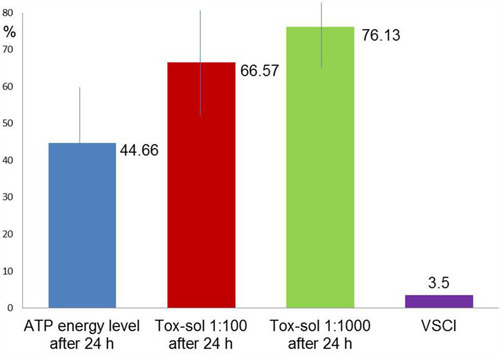
Figure 14 (A and B) In the Rheuma group (A; left window) and Allergy group (B; right window), the ATP activity is reduced to 86.77% and 74.77% of the initial value, respectively.
Abbreviations: Rheuma, rheumatism; h, hours; ATP, adenosine triphosphate; Tox-sol, toxin solution.
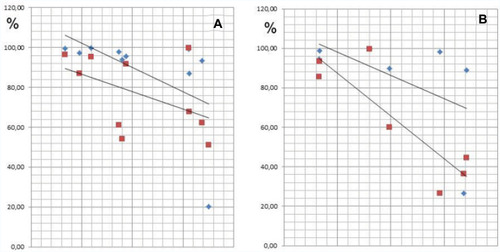
Figure 15 (A and B) In the Neurology group (A; left window) and Tumor group (B; right window), the ATP activity is reduced to 85.13% and 84.87% of the initial value, respectively.
Abbreviations: h, hours; ATP, adenosine triphosphate; Tox-sol, toxin solution.
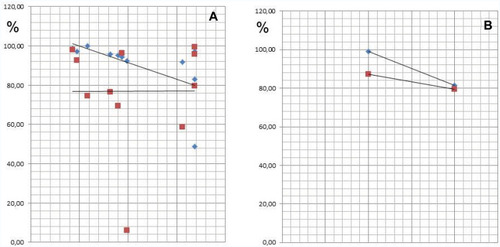
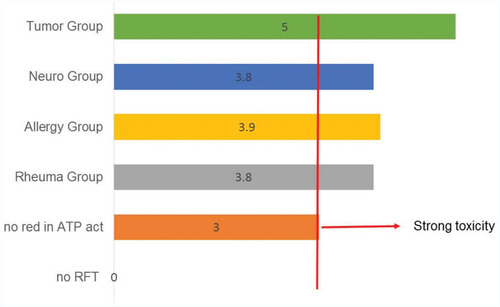
Figure 16 This diagram shows the VSCI values for the different groups.
Abbreviations: Neuro, neurology; Rheuma, rheumatism; ATP, adenosine triphosphate; red, reduction; act, activity; RFT, root-filled teeth; VSCI, volatile sulfur compound indicator.