Figures & data
Table 1 Clinical, Electrocardiographic, and Laboratory Data in Patients Grouped as STD-R ≥50% and STD-R <50%. The p values are Related to Independent Sample’s t-Test for Continuous Variables and Chi Squared for Categorical Variables
Table 2 Comparison of Patients Grouped as Having STE-R ≥50%, or STE-R <50% for Clinically Important Variables
Table 3 Results of Univariate and Multivariate Regression Analyses to Determine Predictive Factors for Sum of ST Depression/Elevation Resolution of More Than 50%
Table 4 Correlation of Sum ST Elevation/Depression Resolution or in the Lead with Maximum ST Deviation in the Presenting ECG with Outcomes of in-Hospital Acute Heart Failure, in-Hospital Death, Major Adverse Cardiac Events, and Death in Follow-Up
Figure 1 (A) Area under the curve for major adverse cardiac events in association with resolution of sigma ST depression or elevation resolution. (B) Area under the curve (AUC) for ROC curve of in-hospital mortality in relation to Sigma STD/STE resolution.
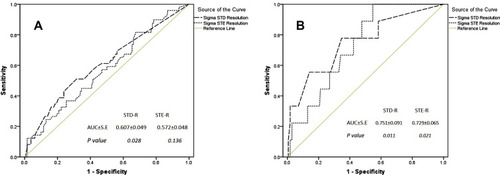
Figure 2 (A) Area under the curve for major adverse cardiac events in relation to resolution of ST depression or elevation in a single lead with maximum ST deviation in presenting electrocardiogram. (B) Area under the curve (AUC) for ROC curve of in-hospital mortality in relation to STD/STE resolution in a single lead with maximum ST deviation in presenting electrocardiogram.
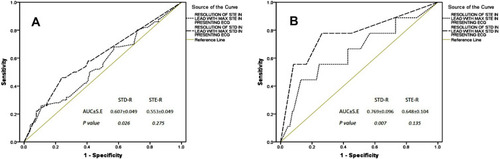
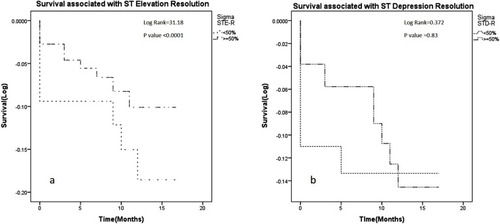
Figure 3 (A) Survival curve in two groups: 1- Sigma ST elevation resolution ≥50%, 2- <50%. In this curve the horizontal line is follow-up time in month(s) and the vertical line is survival based on cumulative survival. (B) Survival curve in two groups: 1- Sigma ST depression resolution ≥50%, and 2- <50%. In this curve the horizontal line is follow-up time in month(s) and the vertical line is survival based on cumulative logarithm.