Figures & data
Table 1 Basic Characteristics of Participants in the Present Study at Baseline and the End of Follow-Up
Figure 1 Changes in values of plasma hs-CRP at the end of follow-up compared with baseline in participants who lost or gained one to six health metrics during that period. The vertical axis represents the changed values of hs-CRP at the end of follow-up compared with baseline. The horizontal axis represents the change in the total number of health metrics that each individual had at the end of follow-up compared with baseline: 0 indicates that the total number of health metrics did not change; positive values (+1 to +6) indicate that the number of health metrics increased; negative values (−1 to −6) indicate that the number of health metrics decreased.

Figure 2 Hazard ratios of each health metric on plasma hs-CRP levels in men (A) and women (B). +1 indicates that the health metric presented was gained at the end of follow-up compared with baseline; −1 indicates that the health metric presented was lost at the end of follow-up compared with baseline.
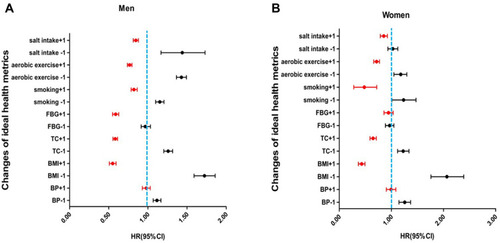
Table 2 Hazard Ratios of the Changes in Number of Ideal Health Metrics an Individual Had During Follow-Up on Plasma hs-CRP Levels in Men and Women
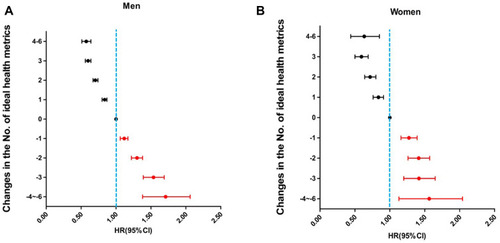
Figure 3 Hazard ratios of change in the number of health metrics on plasma hs-CRP levels in men (A) and women (B). Positive values (+1 to +6) indicate that the number of health metrics increased at the end follow-up compared with baseline; negative values (−1 to −6) indicate that the number of health metrics decreased at the end follow-up compared with baseline.