Figures & data
Figure 1 Protein concentration in the plasma of patients with Crohn’s disease and ulcerative colitis (Median and range). The differences are statistically significant for comparisons between groups (control N=20, CD N = 20 and UC N=20) at *P ≤ 0.05.
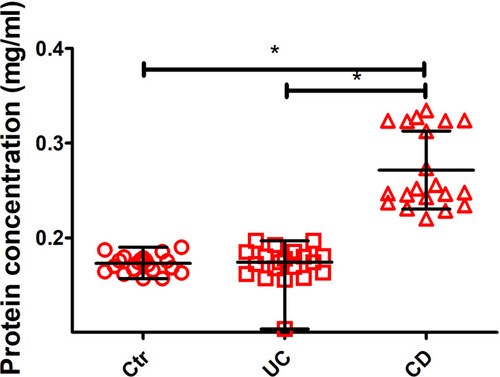
Figure 2 Activity of acidic (A) (pH 5.0; N for all groups=20), neutral (B) (pH 7.0; Ctr N=20, CD N=18, UC N=19) and alkaline (C and D) (pH 7.6; Ctr and UC N=20, CD N=19 and 8.6; N for all groups=20) proteases in the plasma of patients with Crohn’s disease (CD) and ulcerative colitis (UC) (Median and range). The differences are statistically significant for comparisons between groups (control, CD and UC) at *P ≤ 0.05.
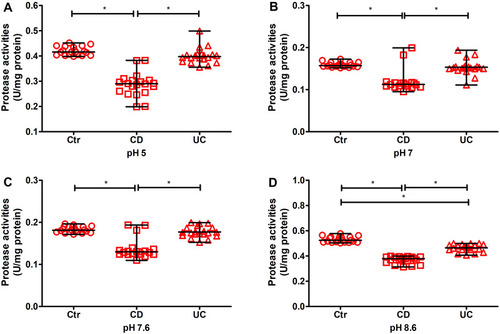
Figure 3 Activity of acidic (A) (pH 5.0) and alkaline (B) (8.6) protease inhibitors in the plasma of patients with Crohn’s disease (CD; N=20) and ulcerative colitis (UC; N=20) and Ctr (N=20) (Median and range). The differences are statistically significant for *P ≤ 0.05.
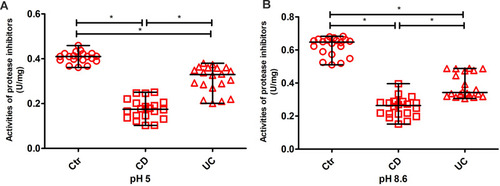
Figure 4 Activities of acidic (A) (pH 5.0; CD act N=13, CD rem N=7), neutral (B) (pH 7.0; CD act N=11, CD rem N=7) and alkaline (C and D) (pH 7.6; CD act N=12, Cd rem N=7 and 8.6; CD act N=13, CD rem N=7) proteases in the plasma of patients with Crohn’s disease – active (act) and in remission (rem) (Median and range). The differences are statistically significant for comparisons between groups (act vs rem) at *P ≤ 0.05.
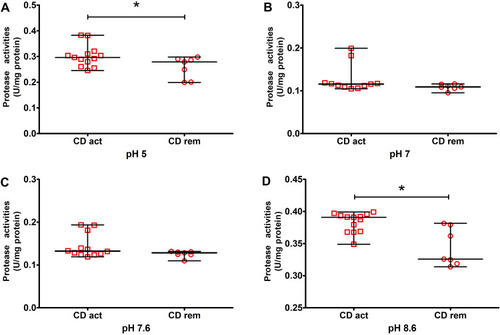
Figure 5 Activity of acidic (A) (pH 5.0; CD act N=13, CD rem N=7) and alkaline (B) (8.6; CD act N=13, CD rem N=7) protease inhibitors in the plasma of patients with Crohn’s disease – active (act) and in remission (rem) (Median and range). The differences are statistically significant for comparisons between groups (act vs rem) at *P ≤ 0.05.
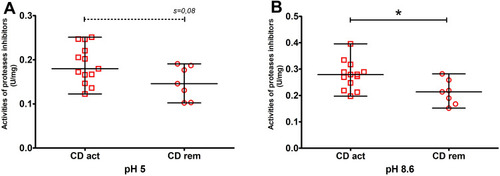
Figure 6 Activities of acidic proteases (pH 5.0) in patients with (N=10) and without biological treatment (N=10). The difference was statistically significant for comparisons between groups (with and without biological treatment) at *P ≤ 0.05. Other differences were statistically non-significant.
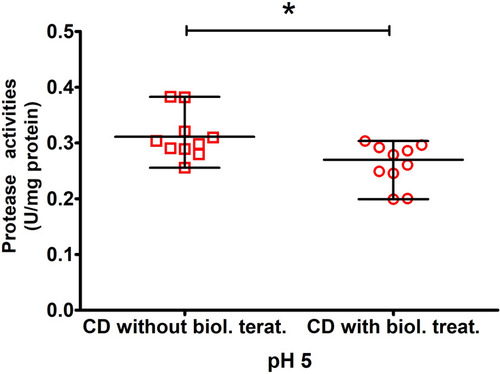
Figure 7 Activities of acidic (A) (pH 5.0; UC act N=12, UC rem N=8), neutral (B) (pH 7.0; UC act N=11, UC rem N=8) and alkaline (C and D) (pH 7.6; UC act N=12, UC rem N=8 and 8.6; UC act N=12, UC rem N=8) proteases in the plasma of patients with UC – active (act) and in remission (rem) (Median and range). The differences are statistically significant for comparisons between groups (act vs rem) at *P ≤ 0.05.
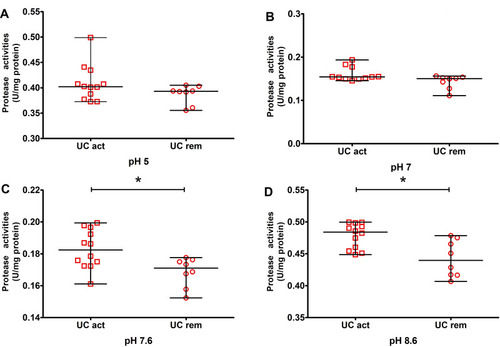
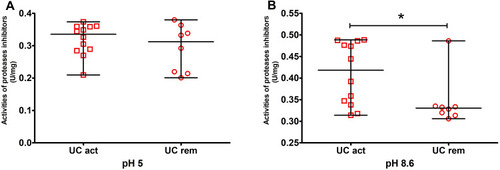
Figure 8 Activities of acid (A) (pH 5.0; UC act N=12, UC rem N=8) and alkaline (B) (8.6; UC act N=12, UC rem N=8) protease inhibitors in the plasma of patients with UC – active (act) and in remission (rem) (Median and range). The differences are statistically significant for comparisons between groups (act vs rem) at *P ≤ 0.05.