
Figures & data
Figure 1 Schematic flow chart of recruiting participants for analysis.
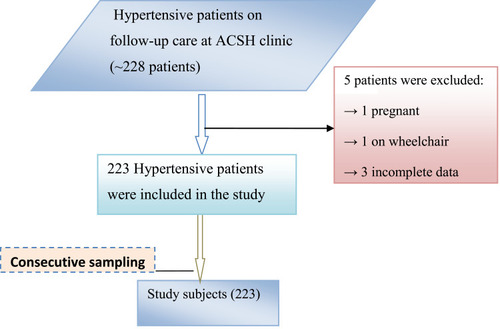
Table 1 Socio-Demographic Characteristics of Hypertensive Patients on Follow Up at ACSH, Ethiopia, 2019
Table 2 Life Style and Anthropometric Related Characteristics of Hypertensive Patients on Follow Up at ACSH, Ethiopia, 2019
Table 3 Clinical Characteristics of Hypertensive Patients on Follow Up at ACSH, Ethiopia, 2019
Table 4 Prescribing Pattern of Antihypertensive Drugs and Common Side Effects Among Hypertensive Patients on Follow Up at ACSH, Ethiopia, 2019
Figure 2 Level of BP control among hypertensive patients on follow-up care at ACSH, Ethiopia, 2019.
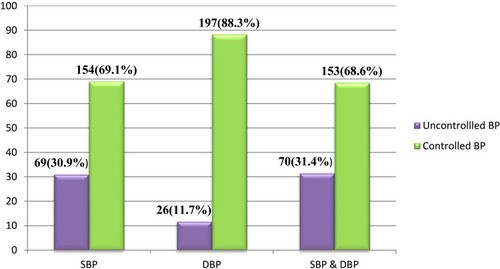
Table 5 Bivariate and Multivariate Logistic Regression Analyses of Predictors of Uncontrolled BP Among Hypertensive Patients on Follow Up at ACSH, Ethiopia, 2019
Figure 3 Magnitude of LVH and Proteinuria among hypertensive patients on follow up at ACSH, Ethiopia, 2019.
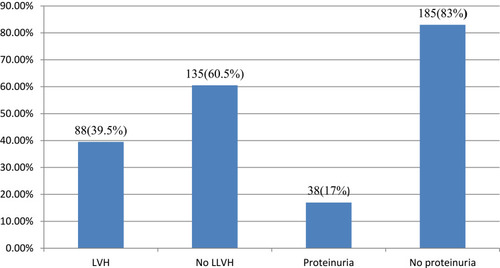
Table 6 Predictors of LVH Among Hypertensive Patients on Follow Up at ACSH, Ethiopia, 2019