Figures & data
Figure 1 Expression of platelet NLRP3 in health subjects and coronary heart disease patients. (A) The relative platelet NLRP3 mRNA level in healthy subjects (n=25), patients with SAP (n=23), and patients with ACS (n=72). (B) The relative platelet NLRP3 mRNA level in patients with UAP (n=23), NSTEMI (n=26), and STEMI (n=23). (C) Representative expression pattern of NLRP3 protein by Western blotting (Left panel) and relative quantification (Right panel) of NLRP3 protein in healthy subjects (n=25), patients with SAP (n=23), and patients with ACS (n=72). (D) Representative expression pattern of NLRP3 protein by Western blotting (Left panel) and relative quantification (Right panel) of NLRP3 protein in healthy subjects (n=25), and patients with UAP (n=23), NSTEMI (n=26), and STEMI (n=23). Data are presented as mean ± SD, P<0.05*, P<0.01**.
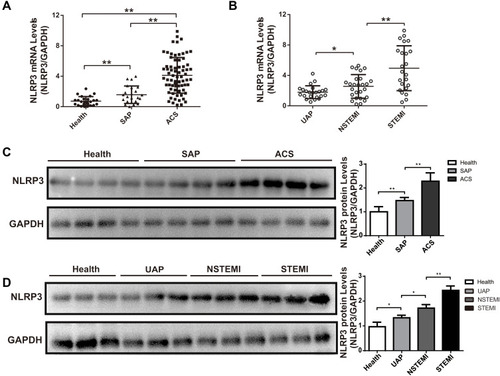
Table 1 Baseline Characteristics and the Level of Platelet Parameters in the Study Population
Figure 2 Correlation between platelet NLRP3 expression and clinical parameters. (A) Correlation between platelet NLRP3 mRNA level and mean platelet volume (MPV, n=252). (B) Correlation between platelet NLRP3 mRNA level and platelet count (PLT, n=252). (C) Correlation between platelet NLRP3 expression and platelet volume distribution width (PDW, n=252). (D) Correlation between platelet NLRP3 expression and the plateletcrit (PCT, n=252). (E) Correlation between platelet NLRP3 mRNA level and left ventricular ejection fraction (LVEF, n=252). (F) Correlation between platelet NLRP3 mRNA level and high-density lipoprotein cholesterol (HDL-C, n=252). (G) Correlation between platelet NLRP3 expression and low-density liptein cholesterol (LDL-C, n=252). (H) Correlation between platelet NLRP3 expression and white blood cell count (WBC, n=252).
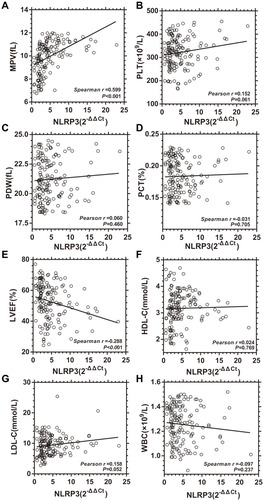
Figure 3 ROC curves of platelet NLRP3 that predicted adverse cardiovascular events in patients who underwent PCI. (A) ROC curves with an AUC of 0.757 (95% CI, 0.680–0.835; P<0.001) of platelet NLRP3 that predicted adverse cardiovascular events in patients who underwent PCI. (B) Division of relative expression of NLRP3 in patients with ACS. The boundary value for NLRP3 is indicated by the black straight line (3.885); Low (n=81): The relative expression of NLRP3 ≤3.885; High (n=71): The relative expression of NLRP3 >3.885.
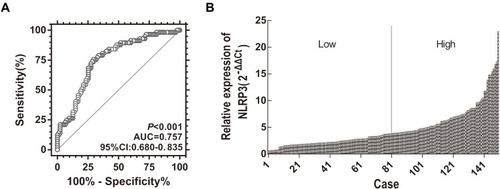
Table 2 Baseline Demographic and Clinical Characteristics of Low and High NLRP3 Groups
Table 3 Univariate and Multivariate Cox Regression Analysis in ACS Patient with PCI
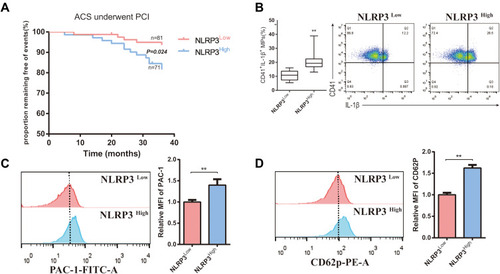
Figure 4 Kaplan-Meier curve analysis for estimated proportion of patients remaining free of adverse cardiovascular events. (A) The proportion of patients that underwent PCI remaining free of events of in the 3-year follow up was significantly different between the NLRP3-low group (n=81) and NLRP3-high group (n=71) (P=0.024). (B) The percentage of IL-1β–expressing platelets was assessed in platelets that were isolated from NLRP3-low group (n=81) and NLRP3-high group (n=71). (C) The expression of PAC-1 in the platelet NLRP3-low group (n=81) and NLRP3-high group (n=71). (D) The expression of CD62p in the platelet NLRP3-low group (n=81) and NLRP3-high group (n=71). Red line, high NLRP3 high expression; blue line, low NLRP3 expression. P<0.01**.