Figures & data
Table 1 Clinicopathologic Characteristics of Patients with HCC
Table 2 Primer Sequence
Figure 1 miR-19a-3p and miR-376c-3p are highly expressed in HCC tissues and cells. (A) Microarray-based analysis of differentially expressed miRNAs between HCC tissues and adjacent normal tissues. (B) miR-19a-3p and miR-376c-3p expression in 21 cases of HCC tissues and adjacent normal tissues tested by RT-qPCR. (C) miR-19a-3p and miR-376c-3p expression in human normal liver cell line THLE3 and HCC cell lines (Hep3B, MHCC-97L, Huh7) determined by RT-qPCR. (D) detection of miR-19a-3p expression in the TCGA database. (E) detection of miR-19a-3p expression at different stages of HCC. (F) analysis of the prognosis of patients with differential expression of miR-19a-3p. (G) detection of miR-376c-3p expression in the TCGA database. (H) detection of miR-376c-3p expression at different stages of HCC. (I) analysis of the prognosis of patients with differential expression of miR-376c-3p. The measurement data were depicted as mean ± standard deviation. The data between two groups were compared by unpaired t-test or and the data among multiple groups were compared by two-way ANOVA. The experiment was repeated three times. *p < 0.05 vs adjacent normal tissues or THLE3 cells.
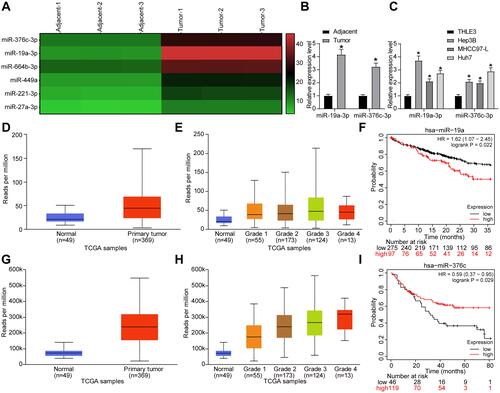
Figure 2 miR-19a-3p/miR-376c-3p deletion inhibits proliferation and invasion while promotes apoptosis of HCC cells. (A) miR-19a-3p and miR-376c-3p expression in Hep3B cells of each group after transfection determined by RT-qPCR. (B) Hep3B cell viability in each group after transfection measured by CCK-8 assay. (C) miR-19a-3p and miR-376c-3p expression in Huh7 cells of each group after transfection determined by RT-qPCR. (D) Huh7 cell viability in each group after transfection measured by CCK-8 assay. (E and F) The invasion and migration abilities of Hep3B and Huh7 cells in each group after transfection determined by Transwell assay. (G) The apoptosis rate of Hep3B and Huh7 cells in each group after transfection determined by flow cytometry. The measurement data were depicted as mean ± standard deviation. Comparison between two groups was conducted by unpaired t-test or and comparisons among multiple groups were analyzed by one-way ANOVA or two-way ANOVA. The experiment was repeated three times. *p < 0.05, **p < 0.01 vs the inhibitor NC group.
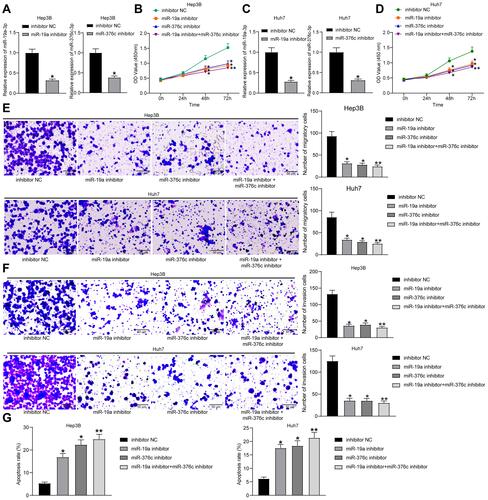
Figure 3 SOX6 is a downstream target of miR-19a-3p or miR-376c-3p. (A) Microarray-based analysis of differentially expressed mRNAs between HCC tissues and adjacent normal tissues. (B) Venn map for screening mRNAs that bind to both miR-19a-3p and miR-376c-3p and are down-regulated in HCC tissues. (C) Predicted binding sites of miR-19a-3p or miR-376c-3p and SOX6. (D) Dual-luciferase reporter gene assay for verifying the relationship between miR-19a-3p or miR-376c-3p and SOX6. (E) SOX6 expression tested by RT-qPCR and Western blot analysis after inhibiting miR-19a-3p or miR-376c-3p in Hep3B cells. (F) SOX6 expression detected by RT-qPCR and Western blot analysis after inhibiting miR-19a-3p or miR-376c-3p in Huh7 cells. The measurement data were depicted as mean ± standard deviation. Comparisons among multiple groups were analyzed by one-way ANOVA. The experiment was repeated three times. *p < 0.05, **p < 0.01 vs the mimic NC group.
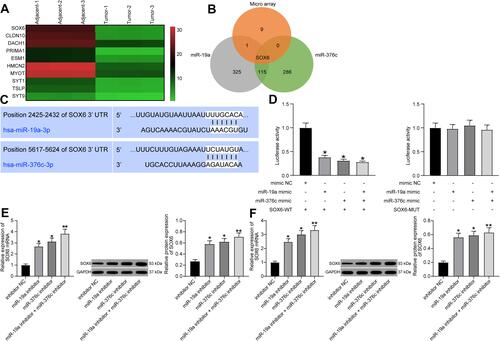
Figure 4 SOX6 is poorly expressed in HCC tissues and cells. (A) SOX6 mRNA expression in 21 cases of HCC tissues and adjacent normal tissues determined by RT-qPCR. (B) The positive rate of SOX6 protein expression in 21 cases of HCC tissues and adjacent normal tissues detected by immunohistochemical staining. (C) SOX6 mRNA expression in human normal liver cell line THLE3 and HCC cell lines (Hep3B, MHCC-97L, Huh7) determined by RT-qPCR. (D) SOX6 protein expression in human normal liver cell line THLE3 and HCC cell lines (Hep3B, MHCC-97L, Huh7) tested by Western blot analysis. (E) detection of SOX6 expression in the TCGA database. (F) detection of SOX6 expression at different stages of HCC. (G) analysis of the prognosis of patients with differential expression of SOX6. (H) correlation analysis of miR-19a-3p and miR-376c-3p with SOX6 expression in HCC tissues. The measurement data were depicted as mean ± standard deviation. Comparison between two groups was conducted by unpaired t-test or and comparisons among multiple groups were analyzed by one-way ANOVA. The experiment was repeated three times. *p < 0.05 vs adjacent normal tissues or THLE3 cells.
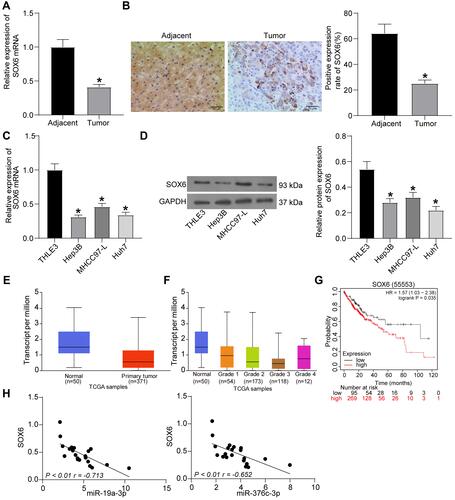
Figure 5 miR-19a-3p and miR-376c-3p are involved in HCC progression through inhibition of SOX6. (A) miR-19a-3p, miR-376c-3p and SOX6 expression in Hep3B and Huh7 cells determined by RT-qPCR. (B) Hep3B and Huh7 cell viability in each group after co-transfection measured by CCK-8 assay. (C and D) The invasion and migration abilities of Hep3B and Huh7 cells in each group after co-transfection determined by Transwell assay. (E) The apoptosis rate of Hep3B and Huh7 cells in each group after co-transfection determined by flow cytometry. (F) Expression of SOX6 and Wnt/β-catenin signaling pathway-related factors (wnt-5a and β-catenin) in Hep3B and Huh7 cells in each group was determined by Western blot analysis. The measurement data were depicted as mean ± standard deviation. Comparisons among multiple groups were analyzed by one-way ANOVA or two-way ANOVA. The experiment was repeated three times. *p < 0.05 vs the oe-NC group; #p < 0.05 vs the oe-SOX6 + mimic NC group.
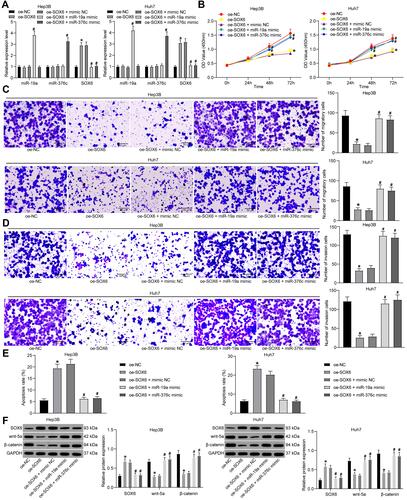
Figure 6 miR-19a-3p and miR-376c-3p inhibitor contributes to suppression of tumorigenesis of HCC cells in vivo. (A) Representative figures for tumors of nude mice. (B) The tumor volume after tumorigenesis in nude mice. (C) The tumor weight after tumorigenesis in nude mice. The measurement data were depicted as mean ± standard deviation. Comparisons among multiple groups were analyzed by one-way ANOVA or two-way ANOVA. n = 5 nude mice. *p < 0.05 vs the inhibitor NC group; #p < 0.05 vs the oe-NC group.
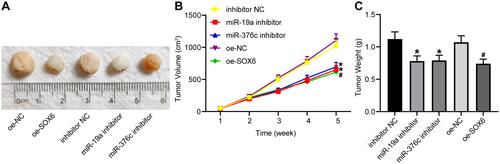
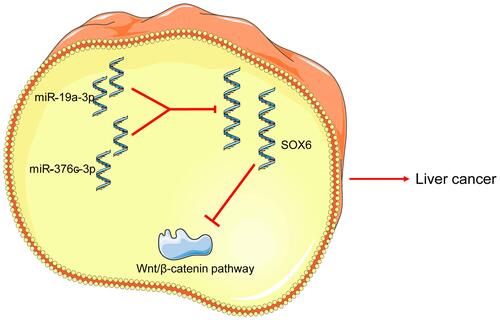
Figure 7 Schematic diagram illustrating possible regulatory roles of miR-19a-3p and miR-376c-3p contributing to proliferation, migration and invasion in HCC. miR-19a-3p or miR-376c-3p activates the Wnt/β-catenin signaling pathway by targeting and inhibiting SOX6 expression, thereby promoting HCC cell proliferation, migration and invasion, and inhibiting apoptosis.