Figures & data
Table 1 The Clinicopathological Characteristics of Patients Included
Table 2 Primer Sequences for RT-qPCR
Figure 1 LncRNA A2M-AS1 is upregulated in BC tissues and cells. (A) RT-qPCR quantitation of A2M-AS1 expression in BC tissues and adjacent normal tissues (n = 26). (B) RT-qPCR quantitation of A2M-AS1 expression in MCF-7, MDA-MB-231, and MDA-MB-468, and MCF-10 cells. *p < 0.05 vs adjacent normal tissues or MCF-10 cells.
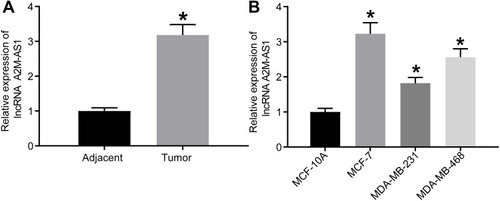
Figure 2 Silencing of A2M-AS1 suppresses BC cell proliferation and invasion. MCF-7 cells were treated with A2M-AS1 knockdown (with sh-NC as control), and MDA-MB-231 cells were treated with A2M-AS1 overexpression (with oe-NC as control). (A) RT-qPCR quantitation of A2M-AS1 expression in MCF-7 and MDA-MB-231 cells. (B) EdU assay for MCF-7 and MDA-MB-231 cell proliferation. (C) MCF-7 and MDA-MB-231 cell colony formation detected by colony formation assay. (D) Transwell assay for MCF-7 and MDA-MB-231 cell invasion. (E) Flow cytometry for MCF-7 and MDA-MB-231 cell apoptosis. *p < 0.05 vs MCF-7 cells treated with sh-NC or MDA-MB-231 cells treated with oe-NC.
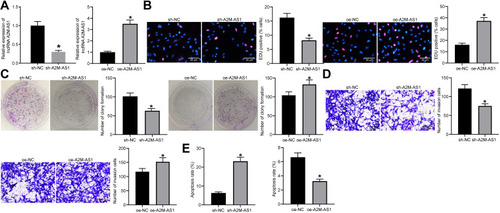
Figure 3 LncRNA A2M-AS1 competitively binds to miR-146b. (A) RT-qPCR quantitation of miR-146b expression in BC tissues and adjacent normal tissues (n = 26). *p < 0.05 vs adjacent normal tissues. (B) RT-qPCR quantitation of miR-146b expression in MCF-7, MDA-MB-231, and MDA-MB-468, and MCF-10 cells. *p < 0.05 vs MCF-10 cells. (C) An online prediction website identified the binding sites between A2M-AS1 and miR-146b. (D) Dual-luciferase reporter assay verified the interaction between A2M-AS1 and miR-146b. *p < 0.05 vs cells treated with NC mimic. (E) RNA-FISH detection of A2M-AS1 subcellular localization in prostate cancer cells. (F) RIP to assess the binding of AGO2 with A2M-AS1. *p < 0.05 vs Bio-NC. (G) RNA pull-down to detect the binding relationship between A2M-AS1 and miR-146b. *p < 0.05 vs IgG.
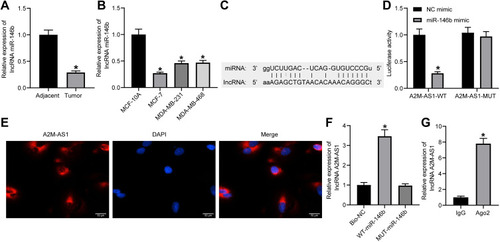
Figure 4 A2M-AS1 accelerates BC cell proliferation, invasion, and colony formation and suppresses apoptosis by competitively binding to miR-146b. MCF-7 cells were transfected with miR-146b mimic (with mimic NC as control) or miR-146b mimic + oe-A2M-AS1 (with miR-146b mimic + oe-NC as control). (A) RT-qPCR quantitation of A2M-AS1 expression in MCF-7 cells. (B) EdU assay for MCF-7 cell proliferation. (C) MCF-7 cell colony formation detected by colony formation assay. (D) Transwell assay for MCF-7 cell invasion. (E) Flow cytometry for MCF-7 cell apoptosis. *p < 0.05 vs MCF-7 cells treated with mimic NC; #p < 0.05 vs MCF-7 cells treated with miR-146b mimic + oe-NC.
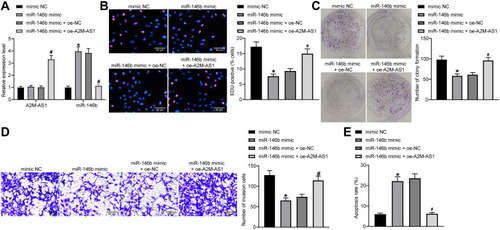
Figure 5 miR-146b could target MUC19 and suppresses its expression. (A) RT-qPCR quantitation of MUC19 mRNA level in MCF-7, MDA-MB-231, and MDA-MB-468, and MCF-10 cells. (B) Immunoblotting of MUC19 protein level in MCF-7, MDA-MB-231, and MDA-MB-468, and MCF-10 cells. (C) Binding sites between miR-146b and MUC19 predicted using TargetScan. (D) Target relationship between miR-146b and MUC19 detected using dual-luciferase reporter gene assay. *p < 0.05 vs MCF-10 cells or MCF-7 cells treated with NC mimic.
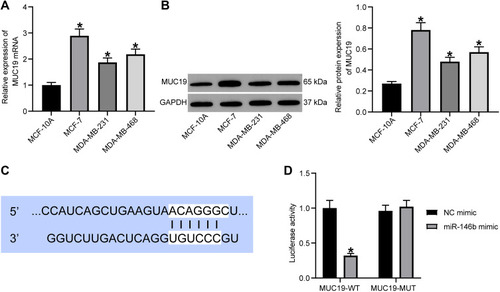
Figure 6 A2M-AS1 knockdown suppresses the BC progression in vitro by disrupting the miR-146b/MUC19/Hippo axis. MCF-7 cells were treated with miR-146b mimic + oe-MUC19 (with miR-146b mimic + oe-NC as control) or sh-A2M-AS1 + oe-MUC19 (with sh-A2M-AS1+ oe-NC as control). (A) RT-qPCR quantitation of expression of A2M-AS1 and miR-146b and MUC19 mRNA level in MCF-7 cells. (B) Immunoblotting of MUC19 protein level in MCF-7 cells. (C) MCF-7 cell proliferation detected by EdU assay. (D) MCF-7 cell colony formation detected by colony formation assay. (E) MCF-7 cell invasion detected by Transwell assay. (F) MCF-7 cell apoptosis detected by flow cytometry. (G) Immunoblotting of YAP and p-YAP protein level in MCF-7 cells. *p < 0.05 vs MCF-7 cells transfected with miR-146b mimic + oe-NC. #p < 0.05 vs MCF-7 cells treated with sh-A2M-AS1+ oe-NC.
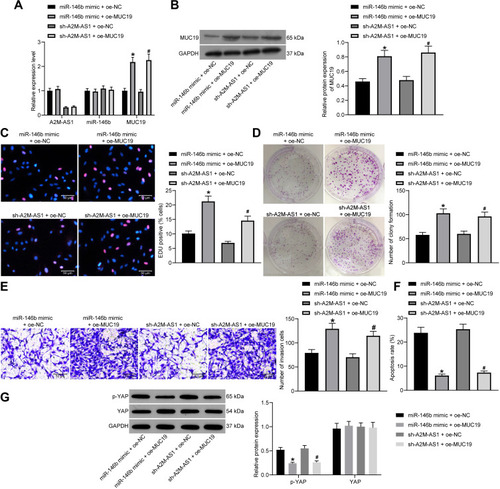
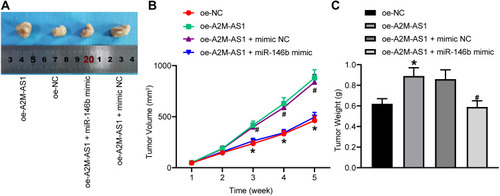
Figure 7 A2M-AS1 downregulation hinders tumorigenesis of BC cells in vivo by binding to miR-146b. Mice were treated with oe-A2M-AS1 (with sh-NC as control) or oe-A2M-AS1 + miR-146b mimic (with oe-A2M-AS1 + mimic NC as control). (A) Tumors in nude mice after tumorigenesis. (B) Tumor volume in nude mice. (C) Tumor weight in nude mice. *p < 0.05 vs mice injected with oe-NC. #p < 0.05 vs mice injected with oe-A2M-AS1 + mimic NC. N = 5.