Figures & data
Figure 1 Flow chart for the participants through the study showing out of 79, only 60 patients accomplished the procedures of the study.
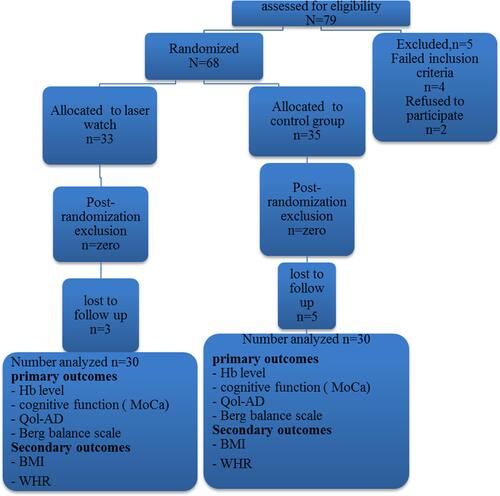
Table 1 Basic Characteristics and Demographic Data of the Study Participants
Figure 2 A study participant who received PBM via laser watch.
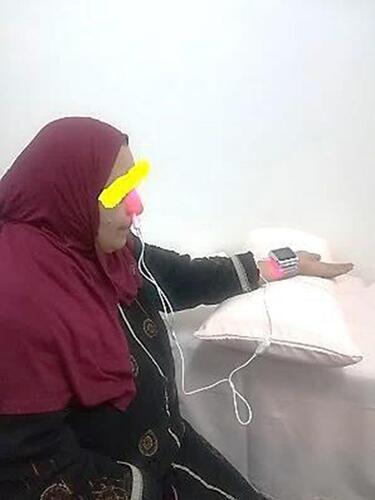
Figure 3 (A) Boxplot chartshowing the post-Intervention change (improvement) in the median of Montreal Cognitive Assessment test score (MoCA) compared to the pre-intervention score within both,study and control groups Significant change occurred in study group more than the control group (P<0.001). (B) Boxplot chart showing the post-Intervention change (improvement) in the median of quality-of- life Qol-AD scores compared to the preintervention score within both study and control groups. Significant change occurred in study group more than the control group (P<0.001). (C) Boxplot chart showing the post-Intervention change (improvement) in the median of Berg balance scale scores compared to the pre-intervention score within both, study and control groups. The study group showed a significantly higher score than the control group (P<0.001).
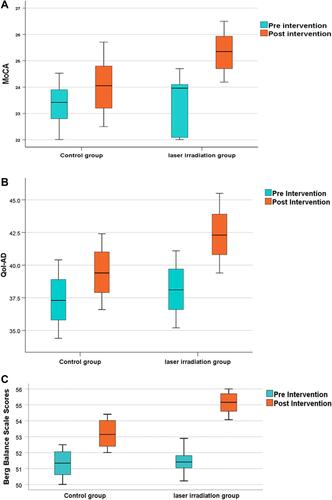
Figure 4 (A) Boxplot chart showing the post-Intervention change (improvement) in the median of Hemoglobin (Hb) concentration compared to the pre-intervention concentration in males within both, studyand control groups. Significant change occurred in study group more than the control group (P<0.001). (B) Boxplot chart showing the post-Intervention change (improvement) in the median of Hemoglobin (Hb) concentration compared to the pre-intervention concentration in females within both study and control groups with a significant increase in HB concentration occurring in the study group compared to the control group (P<0.001).
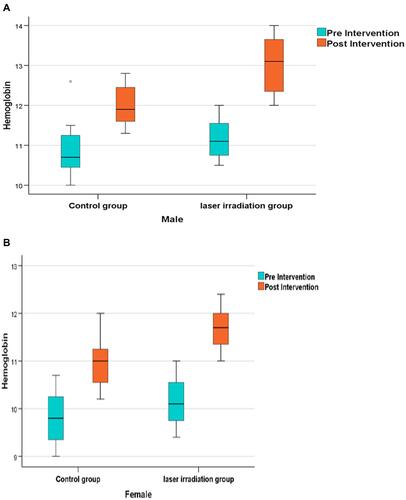
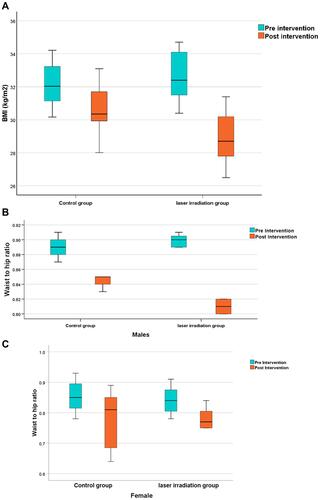
Figure 5 (A) Boxplot chart showing the post-Intervention change (reduction) in the median of Body mass index (BMI) compared to the pre-intervention BMI level within both study and control groups. The study group showed a significantly lower BMI than the control group (P<0.001). (B) Boxplot chart showing the post-intervention change (reduction) in the median of waist-to-hip ratio (WHR) compared to the pre-intervention WHR in males level within both study and control groups, the study group exhibits a significant decrease compared to the control group (P<0.001). (C) Boxplot chart showing the post-intervention change (reduction) in the median of waist-to-hip ratio (WHR) compared to the pre-intervention WHR in females level within both study and control groups (P<0.001).