Figures & data
Table 1 Possible sources of leadCitation6–Citation10
Table 2 Demographics of the students in the blood lead level (BLL) survey by school grade, sex, age, and BLL
Figure 1 Education and work status of father and mother.
Notes: Values are expressed as means ± standard deviation or percentage scores. Odds ratios with 95% CI are reported for all variables entered into multivariate analysis (P < 0.05).
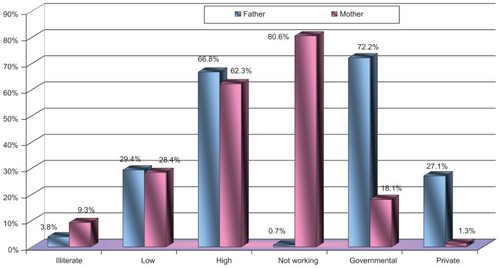
Table 3 Association between blood lead level and family and personal habits
Table 4 Correlation between blood lead level and some studied characters (cluster analysis)
Figure 2 Association between BLL and scores of possible lead exposure (odds ratios [OR]).
Notes: Values are expressed as means ± standard deviation or percentage scores. Odds ratios with 95% confidence intervals (CI) are reported for all variables entered into multivariate analysis (P < 0.05).
![Figure 2 Association between BLL and scores of possible lead exposure (odds ratios [OR]).](/cms/asset/3fefabf9-90d1-4637-87ae-711e59d47ca2/dijg_a_28403_f0002_c.jpg)
Table 5 Mean percent score of possible sources of lead exposure
Table 6 Relationship between blood lead level and hemoglobin level by age group
Table 7 Predictors of high blood lead level among schoolchildren