Figures & data
Table 1 The Success Rate of Exhaled Nitric Oxide Measurement at Different Expiratory Flow Rates
Table 2 The Clinical Characteristics of the Patients and Control
Figure 1 Exhaled nitric oxide in healthy controls, stable and exacerbated COPD patients. FeNO50 increased in stable and exacerbated COPD patients (A). FeNO200 increased in stable and exacerbated COPD patients (B). There was no significant difference of CaNO in healthy controls, stable and exacerbated COPD patients (C).
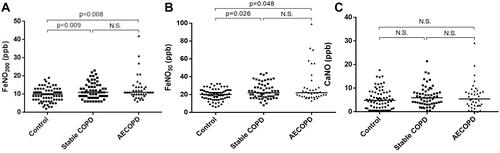
Table 3 Changes in Exhaled NO and Pulmonary Function in AECOPD Patients After Treatment
Figure 2 Changes in FeNO50, FeNO200 and CaNO in different groups. FeNO50 in patients with initial FeNO50> 25 ppb decreased after treatment (A), FeNO50 in patients with initial FeNO50 ≤ 25 ppb did not change after treatment (B), FeNO200 in patients with initial FeNO200> 10 ppb decreased after treatment (C), FeNO200 in patients with initial FeNO200 ≤ 10 ppb did not change after treatment (D), CaNO in patients with initial CaNO > 5 ppb did not change after treatment (E), CaNO in patients with initial CaNO ≤ 5 ppb did not change after treatment (F).
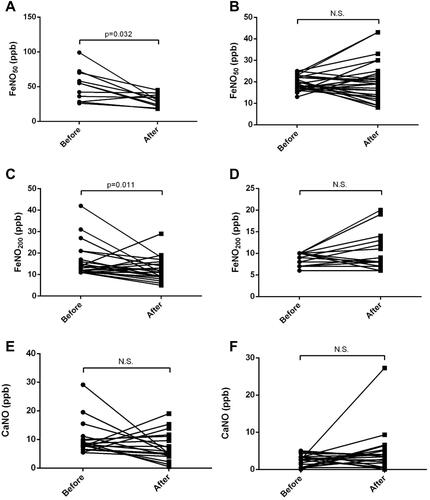
Table 4 The Difference from Baseline in FeNO50, CAT and Pulmonary Function Test
Table 5 The Difference from Baseline in FeNO200, CAT and Pulmonary Function Test
Table 6 The Difference from Baseline in CaNO, CAT and Pulmonary Function Test
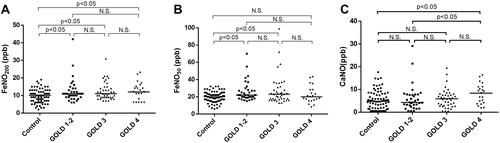
Figure 3 FeNO50, FeNO200 and CaNO in healthy controls and COPD patients of different severity according to the classification of the Global Initiative for Chronic Obstructive Lung Disease (GOLD). FeNO50 was not correlated with different GOLD stages (A). FeNO200 was not correlated with GOLD stages (B). CaNO was elevated at stage of GOLD4 (C).